The high tight flag
Faster and steeper than a standard triangle, and the pattern most likely to fool you into seeing a setup where there's just a random spike. Gate one has to be solid before this one is worth learning.
Why this pattern works
Why a sharp pole produces the biggest moves
The stair-step pattern behind the Triangle guide applies here too, just at a faster tempo. A genuine HTF pole is a sign that real, aggressive demand has shown up all at once, not gradually. That kind of forceful move tends to be followed by continuation once the stock has had a chance to digest it in the flag, rather than being a one-off spike that goes nowhere.
This is exactly why the pole itself has to be sharp and unmistakable, not just a steady grind. A slow, orderly uptrend doesn't carry the same signal, however far it's traveled.
What it actually is
A sharp move, a pullback, then a second breakout
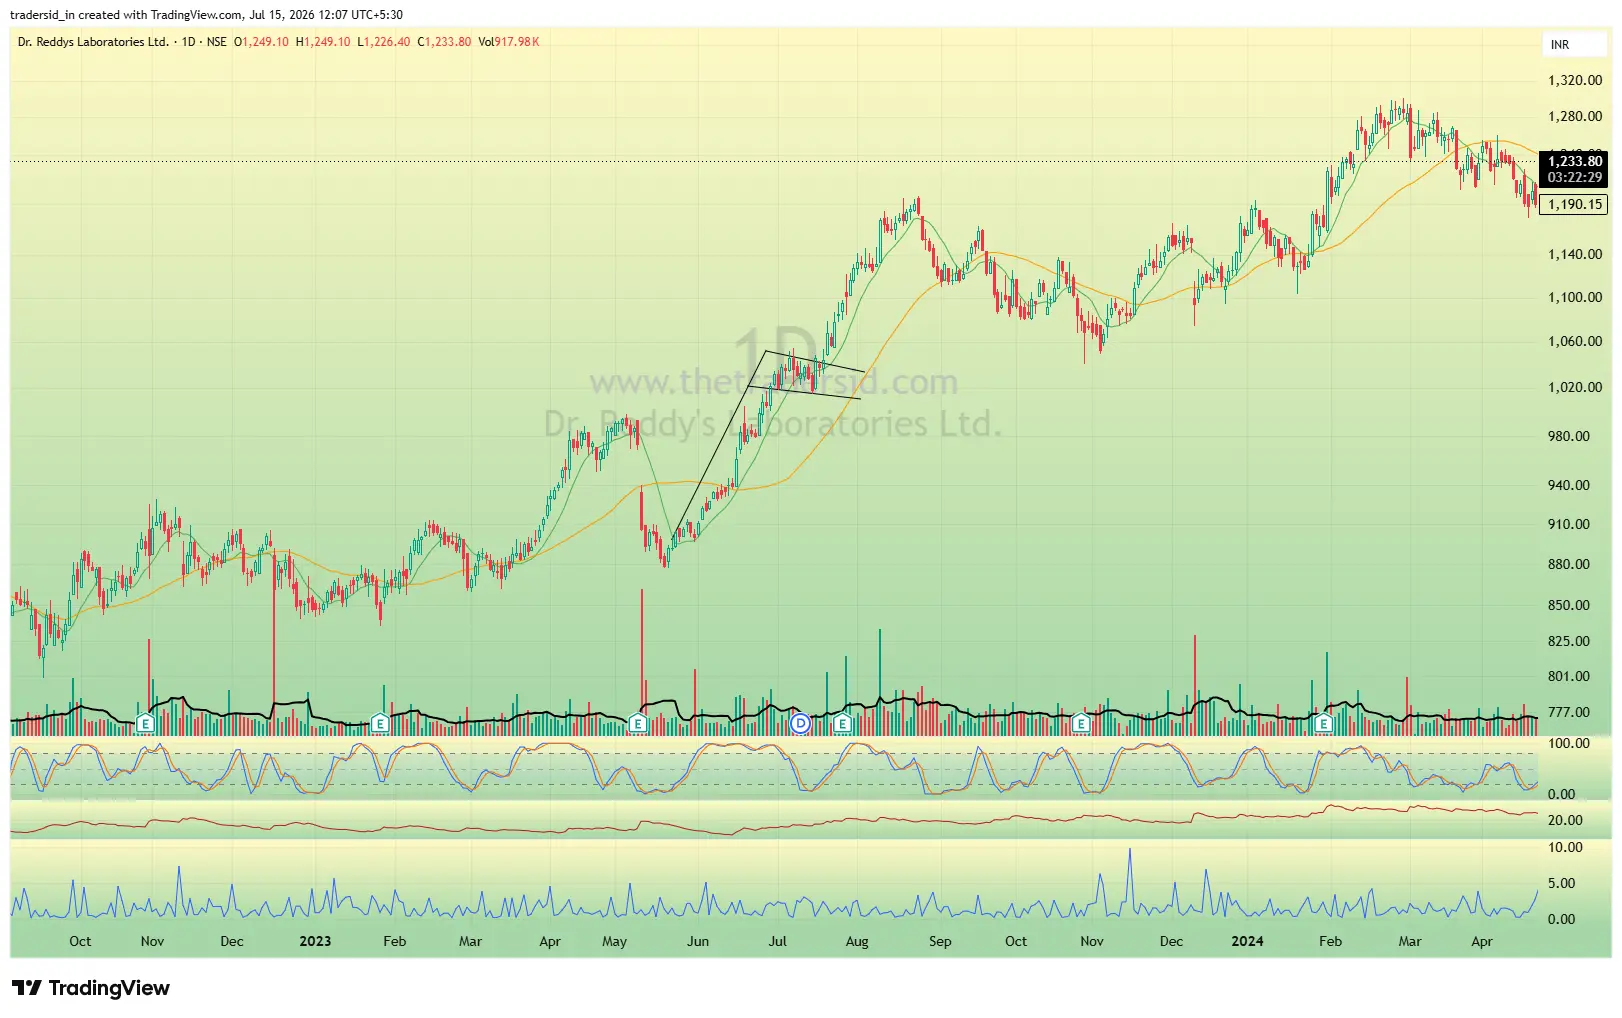
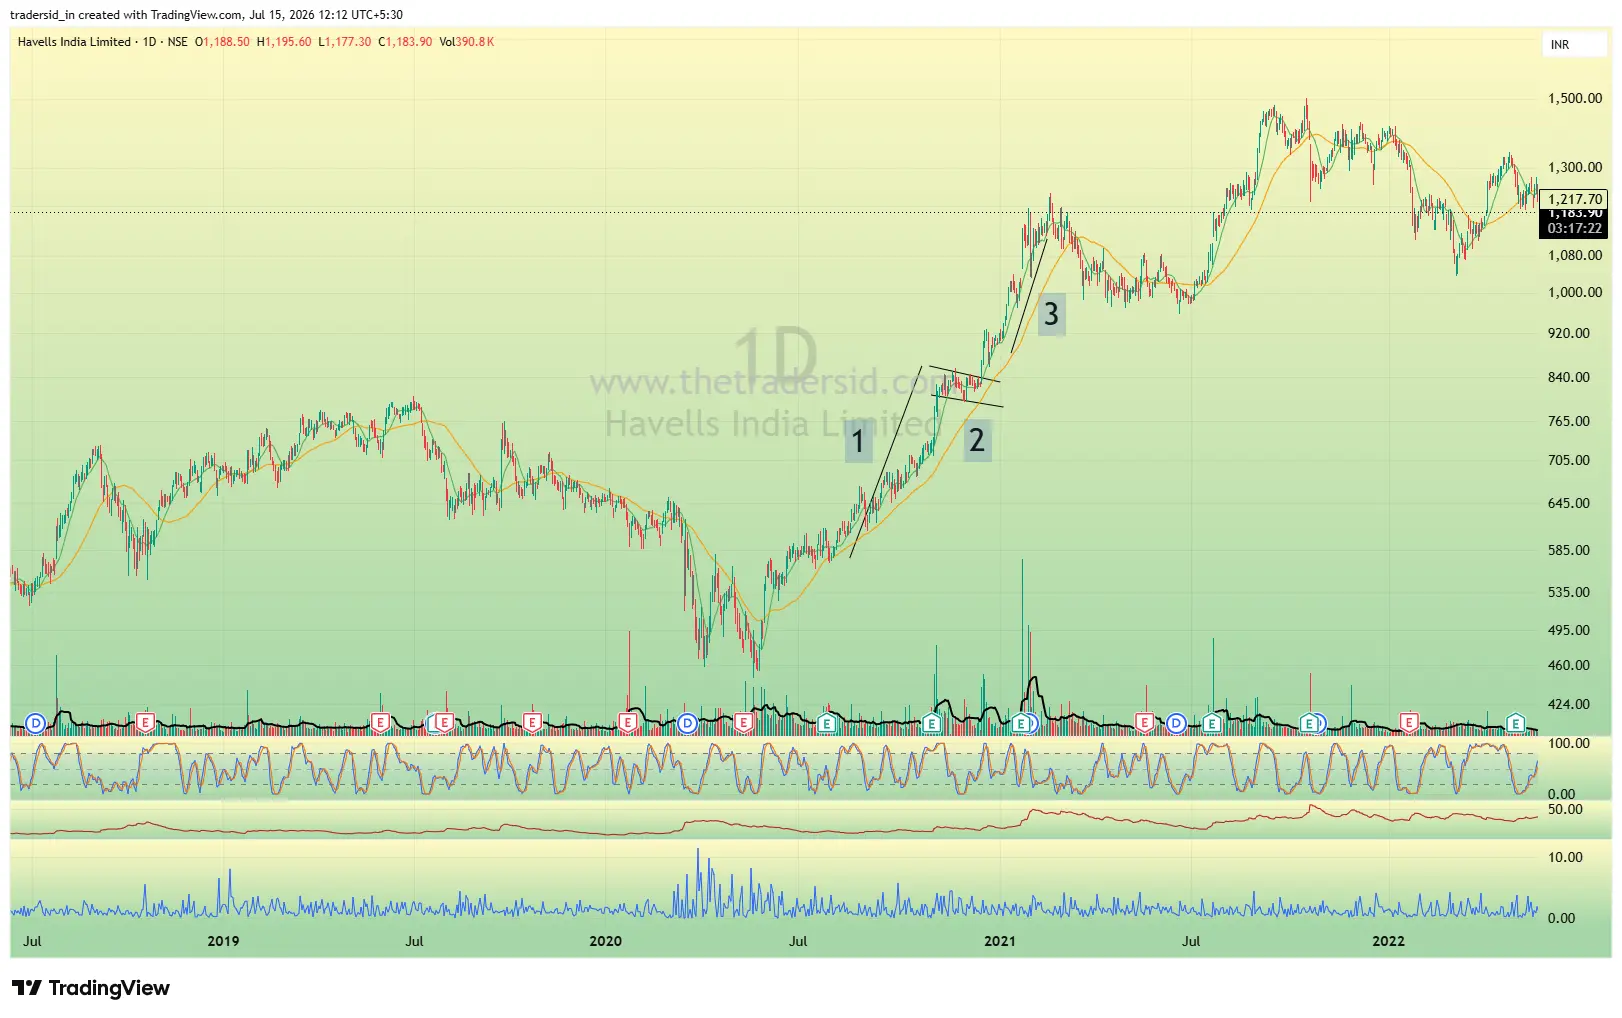
A high tight flag has three parts, and the entry only happens on the third one. First, a fast, forceful rally — the pole. Then a pullback that holds most of the move rather than erasing it. Then, the actual trigger: price comes back and breaks above the high of that pullback a second time.
This matters because it's easy to get excited by the pole itself and jump in too early. The pole is what gets your attention. The pullback is what you wait through. The second breakout, back above the flag high, is what you actually trade.
The four conditions
What actually has to be true
Same rule as gate one — these are mechanical checks, not a vibe. A chart that looks exciting can still fail every one of these.
A genuine, fast rally into the flag
The move into the flag has to be real and forceful, not a slow grind. If the "pole" looks like an ordinary uptrend, it is not an HTF setup.
A shallow pullback, not a deep correction
After the pole, price comes back in a controlled, relatively shallow pullback. A deep giveback of the rally is a different situation entirely, not a flag.
Volume noticeably lighter during the pullback
Participation should fall off during the flag compared to the rally. Light volume on the way down, heavy volume on the way back up, is the signature.
A second breakout above the flag high
The actual entry is not the pole. It is the moment price reclaims and breaks above the high of the flag itself — that second breakout is what you're actually trading.
Building the watchlist
Finding poles before the flag has even formed
The same leadership scan that works for Triangle setups applies here, since an HTF pole is, almost by definition, one of the sharpest possible expressions of relative strength. Scanning for the small number of stocks showing standout performance over the past one, three, and six months tends to surface HTF poles early, often while the flag itself is still forming.
A stock that just posted an outsized move relative to everything else on the watchlist is exactly the kind of name worth watching closely for the pullback and second breakout that complete this setup.
Entry
What the entry actually looks like
Have the stock on a watchlist the moment the pole is identified, with alerts set at the flag high rather than waiting to notice the breakout after the fact. The entry itself is the second breakout, confirmed on real volume, not the pole and not the first pullback.
This can be timed off an intraday opening range or off the daily chart alone, the same choice covered in the Triangle guide. Anticipating the breakout before the flag high actually clears is a common way this setup gets misread, covered in the misreads section below.
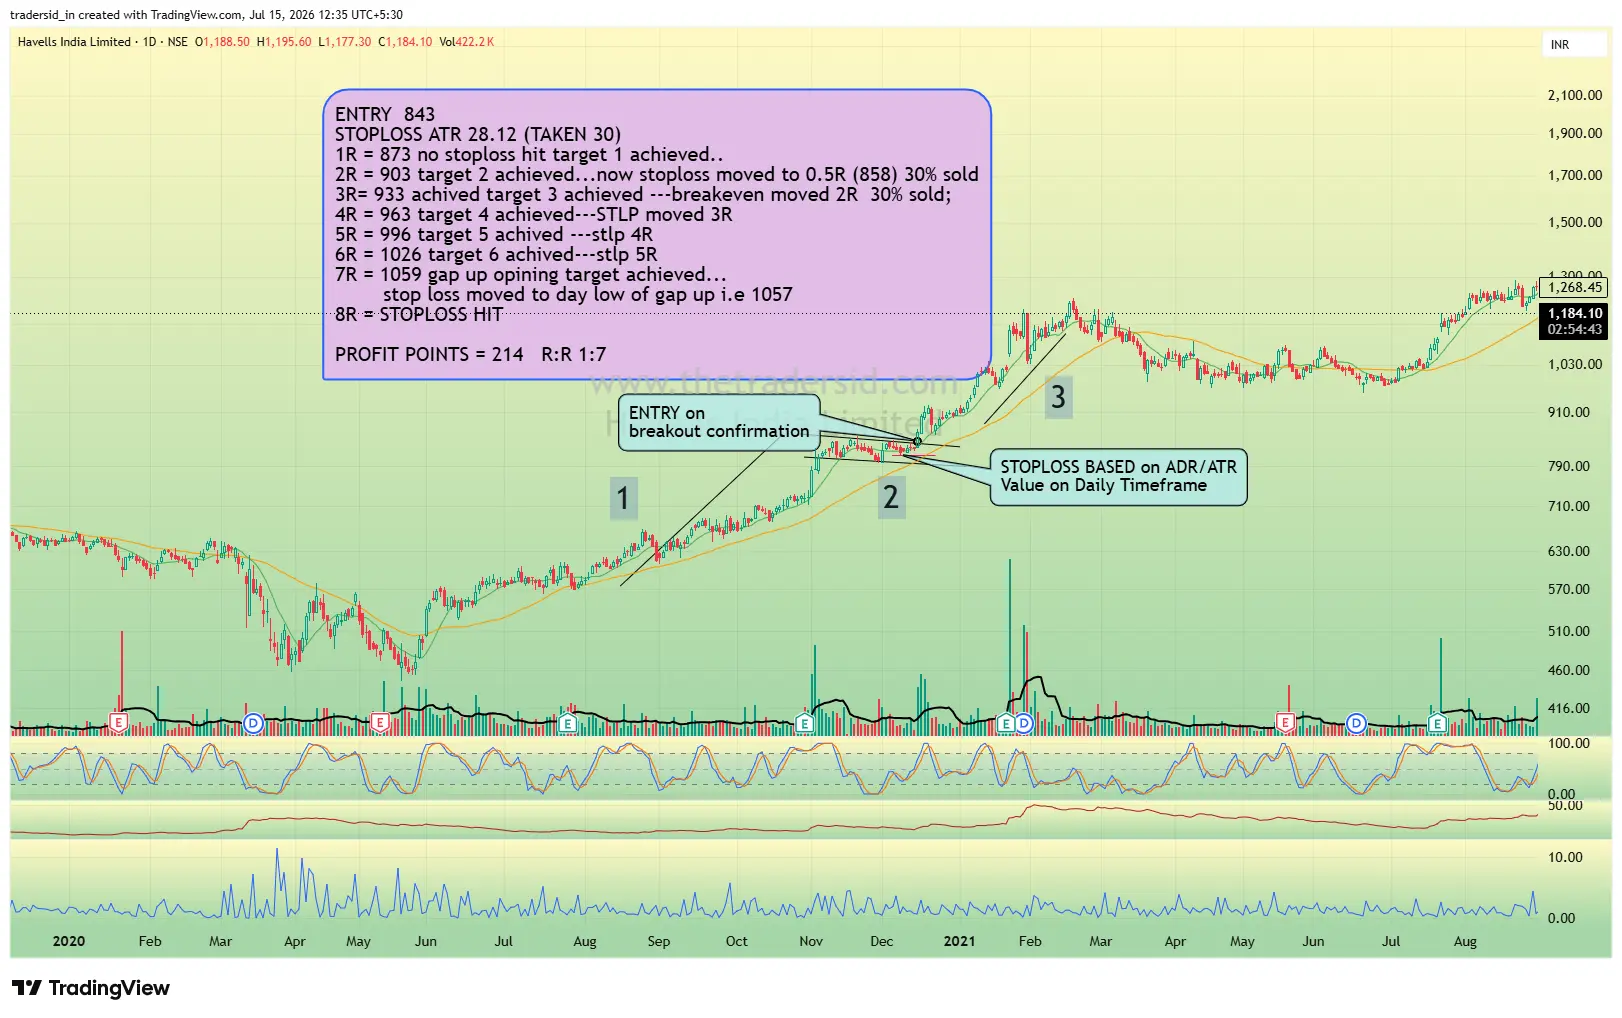
A real example: Havells India, daily chart, entry at 843 on breakout confirmation, well after the pole and pullback had already formed. The entry wasn't taken on the pole itself, and it wasn't taken early on a guess, it was taken once price actually confirmed above the flag high.
Managing the position
Stop placement and taking profit
Because the pole means the stock is already extended and often more volatile than usual, the stop deserves particular care here. The low of the flag itself is the natural reference point, capped by the stock's own ATR or ADR so a single wide stop doesn't distort the risk-to-reward math.
The same partial-exit and trailing approach covered in the Triangle guide applies here too: a portion sold after the first few days of strength, the remainder trailed on the 10-day or 20-day moving average depending on how fast the move is running.
A real trade makes this concrete. Havells India, entry at 843, stop set at an ATR distance of 28.12 points. As the trade worked, the stop moved up mechanically, not on a feeling, at each new R-multiple reached: to breakeven once 2R was hit, then trailed up one full R at a time as targets 3 through 6 were achieved. Partial profit was booked at several of those stages, 30% of the position sold at 2R and again at 3R. By the time a gap-up open reached 7R, the stop moved to the low of that gap-up day itself. The position was finally stopped out at 8R, for a net profit of 214 points and a risk-to-reward of 1:7, an outcome the initial 1R stop distance never could have predicted, but one that a rigid, rule-based trailing approach was able to capture in full.
The full three-stage exit system, and the reasoning behind each stage, is covered in depth in the Exit block of Trading Foundations.
Common misreads
What people call an HTF that isn't one
Four ways this gets misread
Triangle vs HTF
Same family, different speed
An HTF is a triangle variant, not a separate pattern family. The difference is what leads into it and how fast it forms — worth knowing cold before you're scanning a real watchlist.
Standard triangle
Converging trendlines forming gradually, without a sharp prior rally driving it. The structure itself does the work.
HTF
Fast, violent pole first. One shallow flag, not a slow-forming range. The rally does the work, the flag just holds it.
Where this fits
Still not a trade plan
Same as gate one — recognizing an HTF gets you nothing without risk management. If anything, HTF setups need it more than a standard triangle does, because the pole means the stock is already extended and volatile by the time price breaks out a second time.
The full risk framework, entry discipline, and exit mechanics referenced throughout this guide are covered in depth in Trading Foundations, the six-block sequence that picks up exactly where the pattern guides leave off.