The gap up
A different logic entirely from Triangle and HTF. No converging trendlines, no pole and flag, just a stock gapping hard on real volume, breaking out of a real base in a single move.
Why this pattern works
Why a real gap tends to hold
A genuine gap up on real volume is a sign that a meaningful shift in supply and demand happened overnight, all at once, rather than gradually over a session. When that shift is grounded in a real prior base rather than an isolated news reaction, the move behind it tends to have real continuation in it, the same underlying stair-step behavior covered in the Triangle guide, just compressed into a single session instead of building visibly over days or weeks.
This is exactly why the base matters as much as the gap itself. A gap with no real structure behind it has nothing anchoring the move once the initial excitement fades. A gap breaking a stock cleanly out of a real base is a different, more durable signal.
What it actually is
A single move, not a developing structure
Triangle and HTF are both about watching a structure build over time, a converging range, a pole and a flag, and waiting for that structure to resolve. A Gap Up is different. The setup and the trigger happen at almost the same moment, a stock opens meaningfully above its prior close, on real volume, breaking cleanly out of whatever base or consolidation it was sitting in.
This matters because it changes what a trader is actually watching for. With Triangle and HTF, most of the work is in the days or weeks leading up to the breakout, recognizing the structure as it forms. With a Gap Up, the structure that matters, the prior base, is already in place before the gap happens, and the actual signal arrives all at once, at the open, rather than building gradually into a confirmed close.
The four conditions
What actually has to be true
Same rule as gates one and two, these are mechanical checks, not a reaction to an exciting-looking green candle. A stock can gap up hard and still fail every one of these.
A genuine gap, not just a strong day
The stock opens meaningfully above the prior close, a real price gap on the chart, not a stock that simply grinds higher intraday without ever gapping open.
Real volume behind the gap
Volume on the gap day well above the recent average. A gap on ordinary volume is far more likely to fill and fail than one backed by genuine, heavy participation.
A clean base or consolidation before the gap
The gap should be breaking the stock out of a real prior structure, a base, a range, a consolidation, not gapping up in the middle of an already-extended, directionless move.
The gap holds, rather than fills immediately
Price staying above the gap in the sessions that follow, rather than drifting back down to close it, confirms the move has real conviction behind it rather than being a one-day event.
Building the watchlist
Finding gap candidates before the open
Gap Up setups are, by nature, the hardest of the three patterns to see coming, since the actual signal only arrives at the open. What can be done in advance is narrowing the field of candidates: the same relative-strength scan used for Triangle and HTF, the small handful of stocks showing the strongest performance over the past one, three, and six months, plus a check for a genuine base or consolidation already sitting in place.
A stock already showing real leadership, sitting in a clean base, is a far more likely candidate for a gap that holds than one pulled at random from a scanner the morning after it already happened.
Entry
What the entry actually looks like
Unlike Triangle and HTF, there is no waiting for a confirmed close through a trendline here, the gap itself is the trigger. The entry is taken on the open, or shortly after, once the gap has been confirmed as genuine, real volume, a real prior base, not a reaction to scheduled news alone.
Because the entire signal arrives in a single session, there is less room to wait for additional confirmation than with the other two setups. This is exactly why the volume and base checks from the four conditions above have to be run quickly and mechanically, rather than skipped in the rush of an exciting opening move.
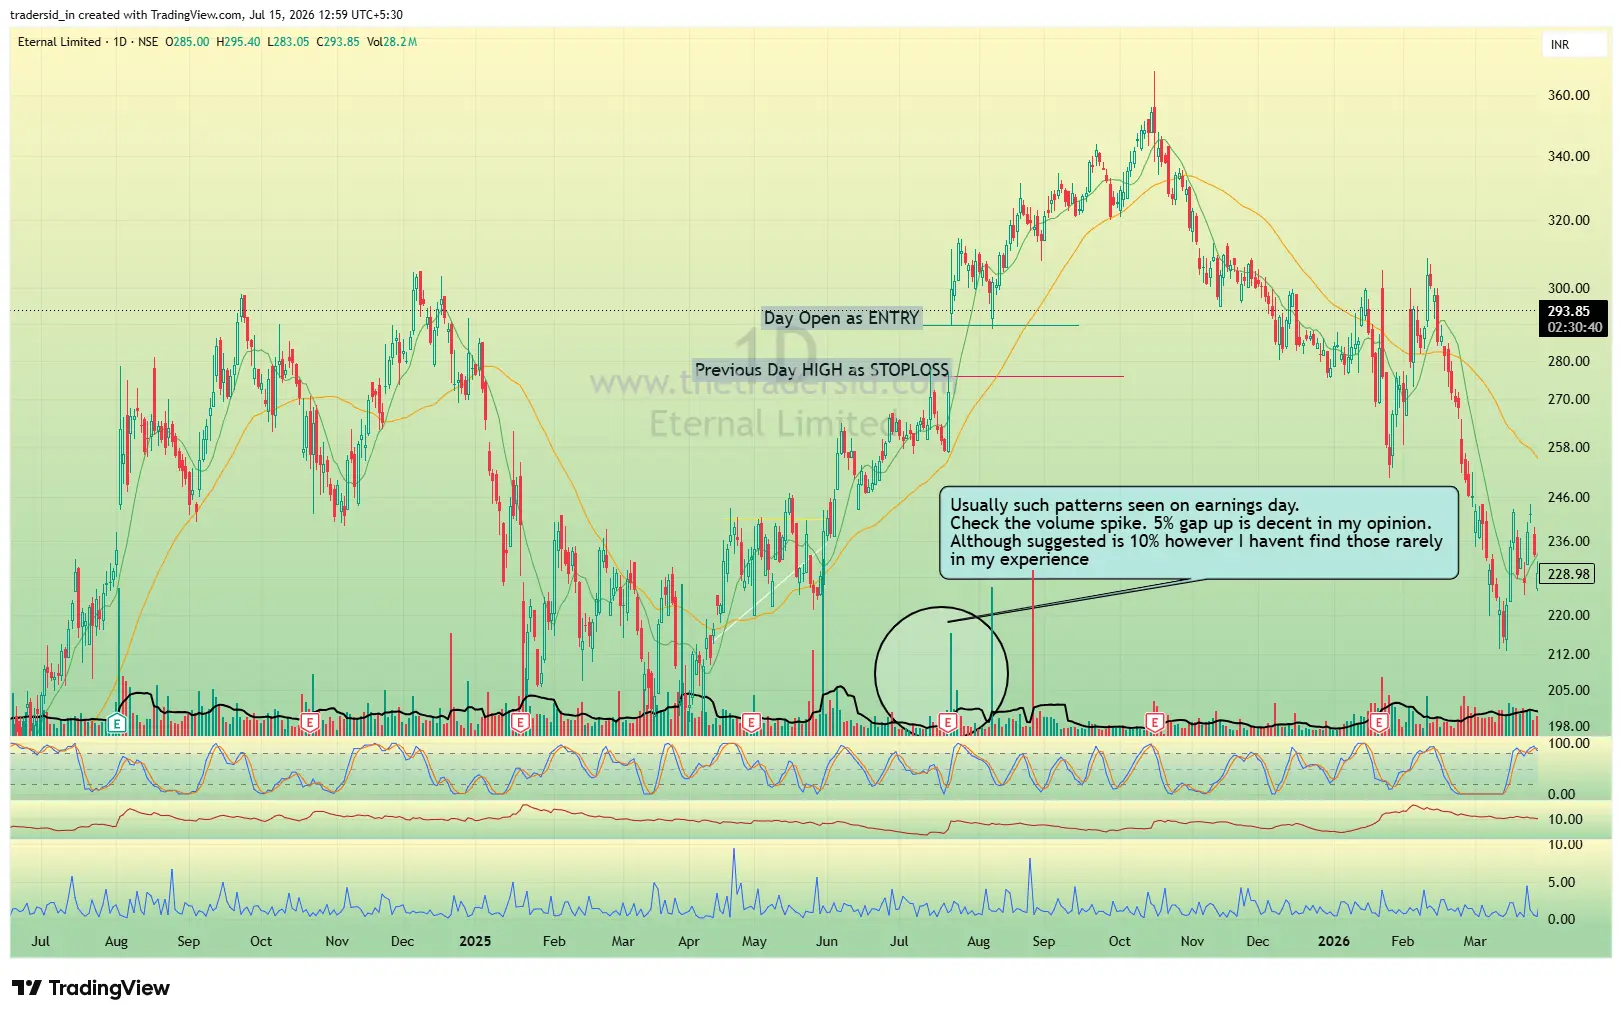
A real example: Eternal Limited, daily chart, entry taken directly at the day's open on the gap, with the previous day's high used as the stop reference. Worth being honest about where these setups actually show up: in practice, the cleanest gaps tend to appear around earnings days specifically, not despite them. A 10% gap is the textbook threshold, but genuinely rare. A 5% gap on real volume, backed by the base and volume conditions above, is a reasonable, more realistic bar in practice.
Managing the position
Stop placement and taking profit
The stop typically sits below the gap itself, or below the prior day's close if the gap has partially filled, which can mean a wider stop distance than a trendline-based setup usually requires. A common, simple reference: the previous day's high, used as the stop against a day-open entry, as shown in the Eternal Limited example above. This makes getting position sizing right, from that wider stop distance, especially important, covered in full in the Risk Management block of Trading Foundations.
Once the position is open, the same partial-exit and trailing approach covered in the Triangle and HTF guides applies here too: a portion sold as the move develops, the remainder trailed on the 10-day or 20-day moving average rather than exited all at once on the first sign of a pause.
The full three-stage exit system, and the reasoning behind each stage, is covered in depth in the Exit block of Trading Foundations.
Common misreads
What people call a Gap Up that isn't
Four ways this gets misread
The first item on this list is worth sitting with directly, since it's the most common source of confusion, and the easiest one to get wrong in either direction. Earnings days aren't automatically disqualifying, in practice they're where a real number of genuine gap setups actually show up. What matters isn't whether the gap happened on an earnings date, it's whether the base, volume, and hold conditions above are actually present. A stock gapping up hard with no real base behind it, purely on a surprise number, can look identical on the chart to a stock gapping out of a genuine prior structure into that same earnings date. The difference isn't visible in the shape of the candle. It's in whether the setup was already developing before the news arrived.
Gap Up vs Triangle and HTF
A genuinely different family
Triangle and HTF are close cousins, both trendline-based, both about a structure resolving into a breakout. Gap Up doesn't belong to that family at all, and it's worth being explicit about why, since treating it as just a faster version of the other two leads to real misreads.
Triangle / HTF
A structure builds over days or weeks. The breakout is a confirmed close through a specific trendline or flag high, arrived at gradually.
Gap Up
The structure is a prior base, already formed. The breakout itself happens in a single session, at the open, all at once.
Where this fits
Still not a trade plan
Same as gates one and two, recognizing a Gap Up gets you nothing without a real entry rule, a real exit plan, and real risk management behind it. If anything, Gap Up setups need more care here than the other two, since the stop often has to sit below the gap itself or the prior day's close, which can mean a wider stop distance than a trendline-based setup typically requires.
This guide is about training your eye to recognize the shape, not about the mechanics of entry, exit, position sizing, or risk. Those are covered in full, and apply identically across all three setups, in Trading Foundations, the six-block sequence that picks up exactly where these three pattern guides leave off.