Triangle patterns
Symmetrical and ascending trendlines converging on a stock. This is a separate setup from HTF, its own gate, its own read.
Why this pattern works
Why the biggest winners move this way
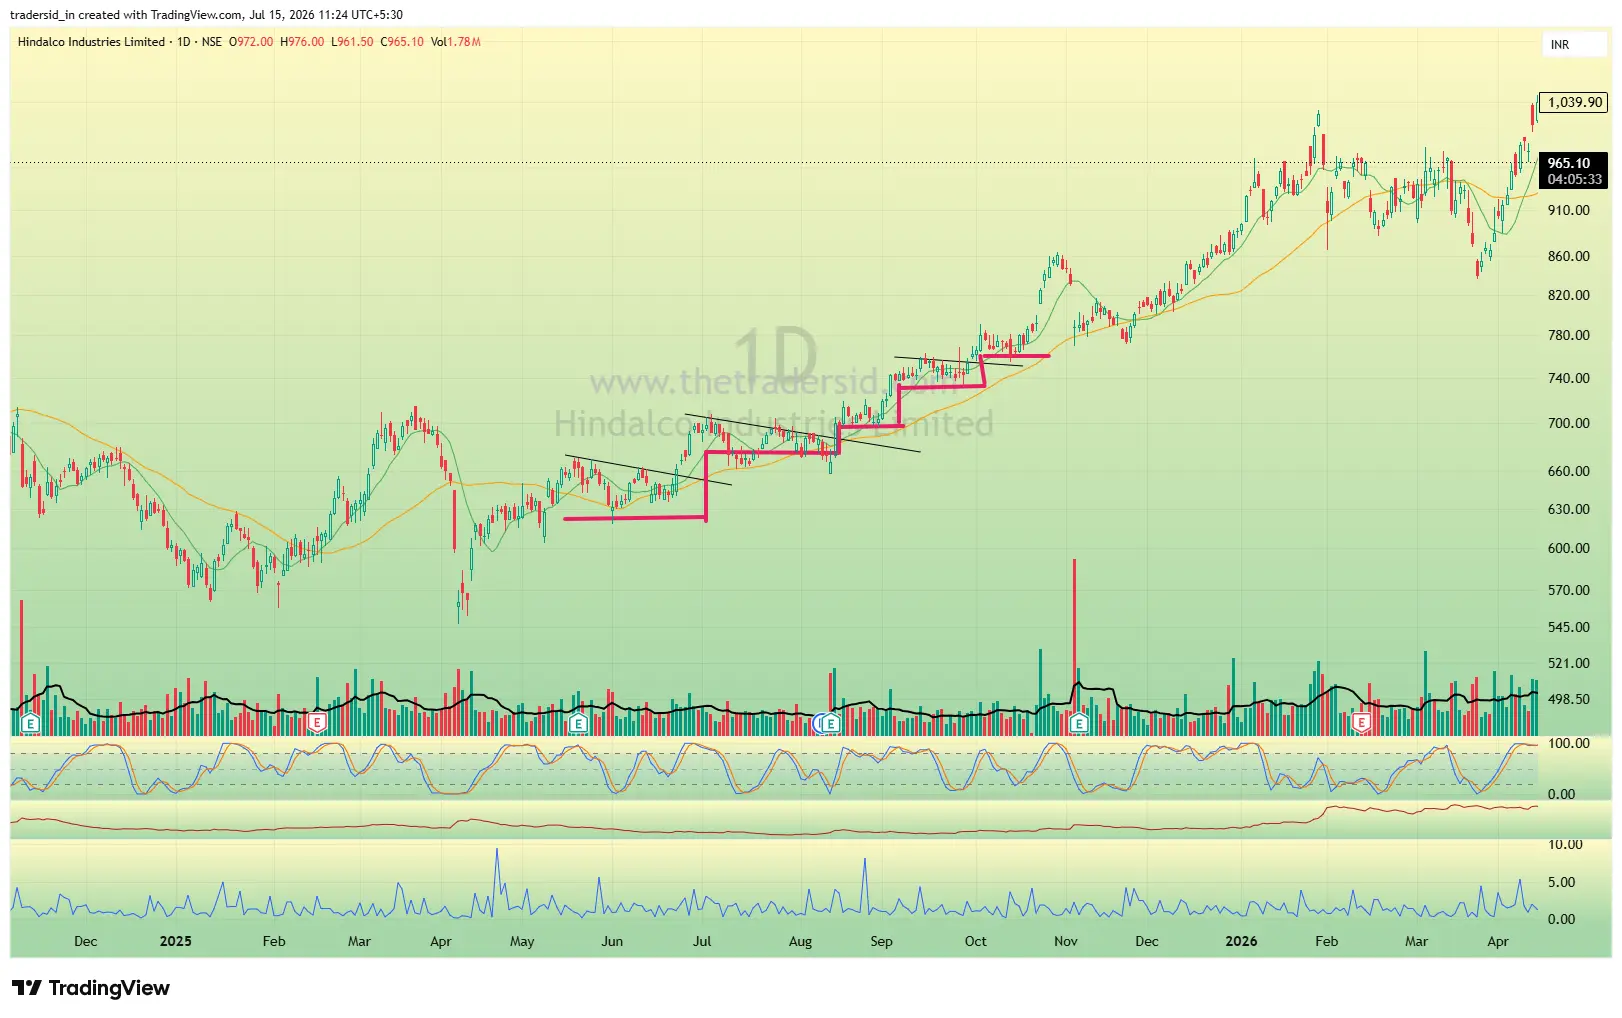
Study a large enough sample of the biggest winning stocks and a pattern shows up again and again: they tend to move in stair-steps. A strong move higher, a pause, a period of sideways consolidation, then another move. This isn’t every stock, and it isn’t every move, but it’s common enough among genuine market leaders that it’s worth building a setup around.
A triangle is one of the shapes that stair-step pause can take, price coiling between two converging trendlines before the next leg. Recognizing the shape is only useful once it’s connected to why leading stocks actually behave this way in the first place.
What it actually is
Two trendlines, actually converging
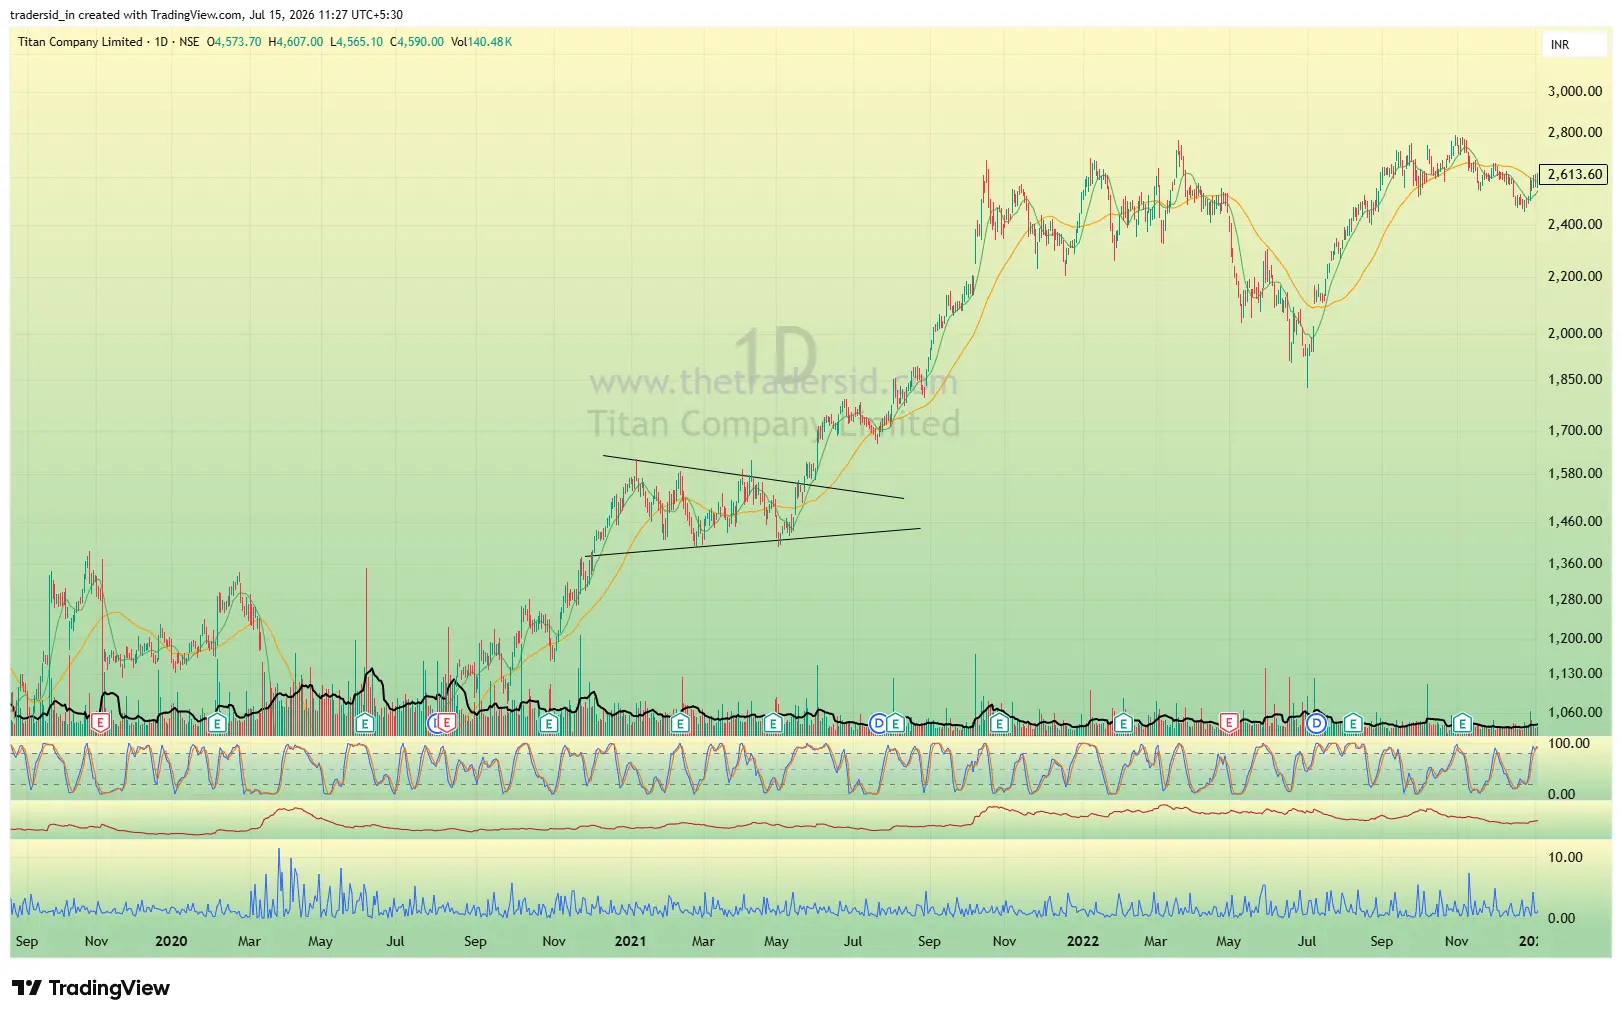
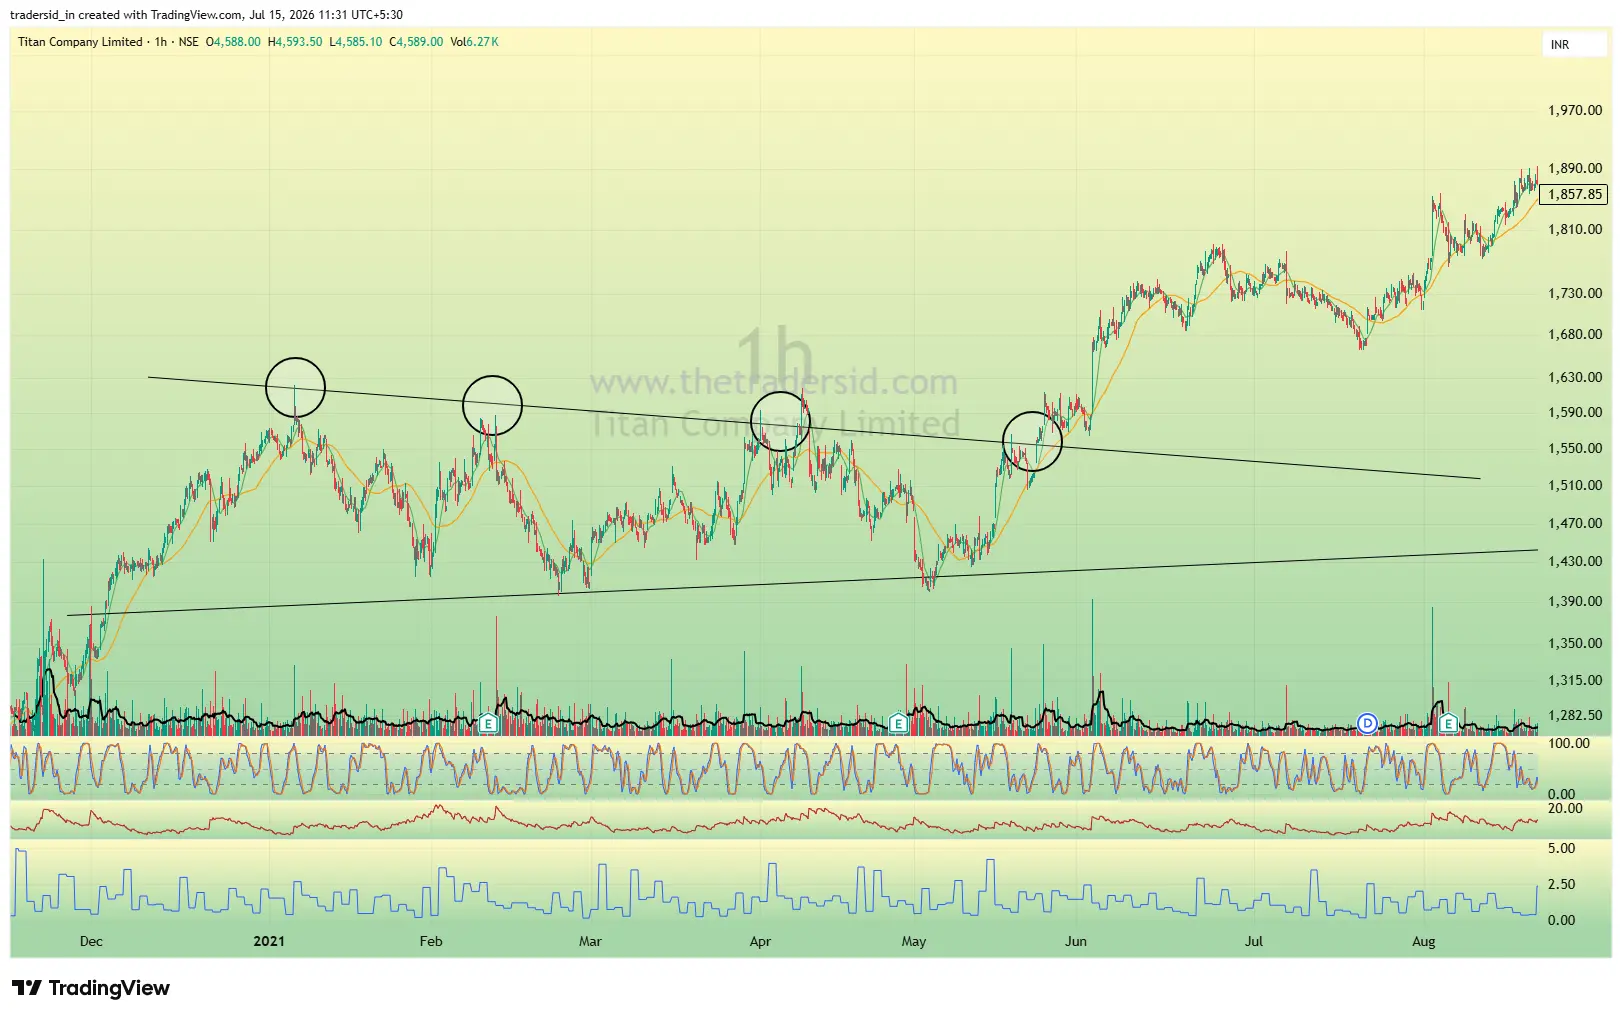
A triangle forms when price gets squeezed between two real trendlines, a rising line connecting the lows and a flat or descending line connecting the highs, actually narrowing toward a point rather than just sitting inside a wide, loose range. The setup is the breakout out of that narrowing structure.
This is genuinely different from HTF. HTF starts with a sharp pole and is defined by that rally. A triangle doesn't require a violent prior move at all, it's about the trendlines themselves converging, however the stock got there.
The four conditions
What actually has to be true
Same rule as every gate in this series. These are mechanical checks, not a feeling about how the chart looks.
Two trendlines genuinely converging
A rising line off the lows and a flat or descending line off the highs, actually narrowing toward each other, not just two lines drawn loosely across a wide range.
Symmetrical or ascending, not descending
Support rising into resistance (ascending), or both lines converging toward a point (symmetrical). A descending triangle is a different, weaker structure and isn't what this setup is looking for.
Volume contracting as the triangle narrows
Same logic as any contraction pattern. Participation should be drying up as price gets squeezed between the two lines, not picking up.
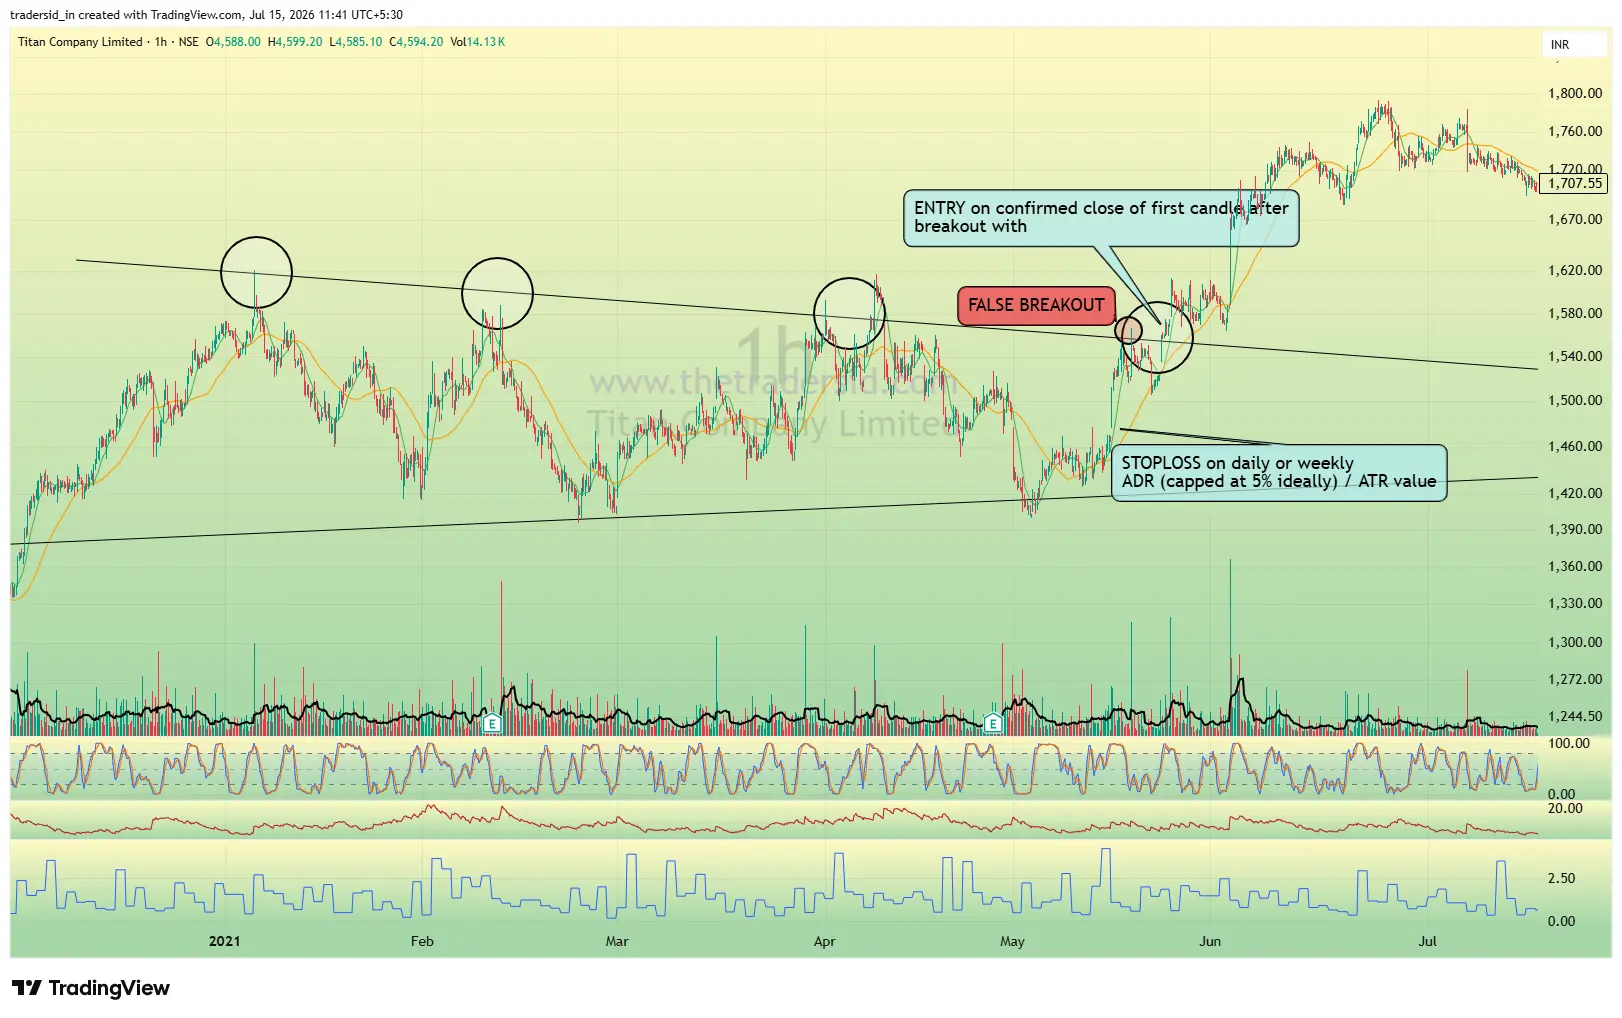
A pullback after the first breakout is still valid
Price breaking the triangle and coming back to retest it before continuing is still part of this same setup. It isn't a failure on its own.
Building the watchlist
Finding candidates before you look at a single chart
Waiting to stumble across a triangle by scrolling through charts one at a time isn't a real process. A faster, more repeatable starting point: scan for the small handful of stocks showing the strongest relative performance across three timeframes together, the past one month, three months, and six months. Stocks that lead on all three at once are the names most likely to be forming, or about to form, the kind of setup worth watching closely.
This narrows a universe of hundreds of stocks down to a short, genuinely actionable watchlist before a single triangle has even been identified on a chart.
Entry
What the entry actually looks like
Have the watchlist ready before the market opens, with alerts set and position size already worked out, not decided in the moment. The entry itself is the breakout out of the triangle, confirmed on real volume.
This can be timed off an intraday opening range (the first 1, 5, or 60-minute candle) or, just as validly, off the daily chart alone, entering as the stock starts to break out. Anticipating the breakout before it's confirmed is possible but calls for more experience and isn't the more reliable approach.
Managing the position
Stop placement and taking profit
The stop sits at the low of the day, capped by the stock's own ATR or ADR so the risk-to-reward math doesn't get distorted by an oversized stop. A stock with a 5% ADR shouldn't carry a stop wider than roughly 5%.
A common approach to managing the position once it's working: sell a third to half of it after three to five days, move the stop to breakeven on the remainder, then trail what's left using the 10-day or 20-day moving average depending on how fast the stock is moving. The exit on the trailing portion comes on the first confirmed close below that average, not before.
The full three-stage exit system, and the reasoning behind each stage, is covered in depth in the Exit block of Trading Foundations.
Common misreads
What people call a triangle that isn't one
Four ways this gets misread
Triangle vs. HTF
Two separate setups, not one family
It's worth being direct about this, since the two can look similar at a glance. A triangle is defined by its converging trendlines. HTF is defined by a sharp prior rally, the pole, followed by a pullback and a second breakout. A stock can form a triangle with no pole behind it at all, and that's still a completely valid triangle setup, not a lesser or incomplete version of HTF.
Triangle
Defined by two converging trendlines. No requirement for a sharp prior rally. Can take longer to form.
HTF
Defined by the pole first. Fast, violent rally, then a pullback, then a second breakout above that pullback.
Where this fits
Still not a trade plan
Same as every pattern gate in this series. Spotting a triangle tells you where to look. It doesn't tell you where you're wrong, what your risk is, or how much to size. Those are covered in full in Trading Foundations, the six-block sequence that picks up exactly where the pattern guides leave off.