Lodha: Inside the Triangle Setup We’re Watching Closely
Lodha has been on our radar for a while, and this week it earns a proper deep dive. The weekly chart is telling a story worth walking through step by step, because it captures almost everything we look for in a triangle setup, minus the one thing that would make it actionable today.
The base that built the story
Start with the weekly timeframe. Going back, Lodha built a strong base with a well defined lower trendline. That base held for a while before the stock broke down through it in February this year, falling all the way toward the 600 to 700 zone. That kind of breakdown usually kills a setup. What matters is what came next.
The stock reversed sharply off that low, climbed back above the base it had broken, and in doing so, that old base flipped from support to resistance and got reclaimed. That reclaim is the first real signal here. A stock that loses a level, bottoms out, and then fights its way back above it is showing you something about demand that a stock which just drifts sideways cannot.
Since that reclaim, price has worked its way back into a triangle zone, and that is the pattern we are watching right now.
What the moving averages are doing
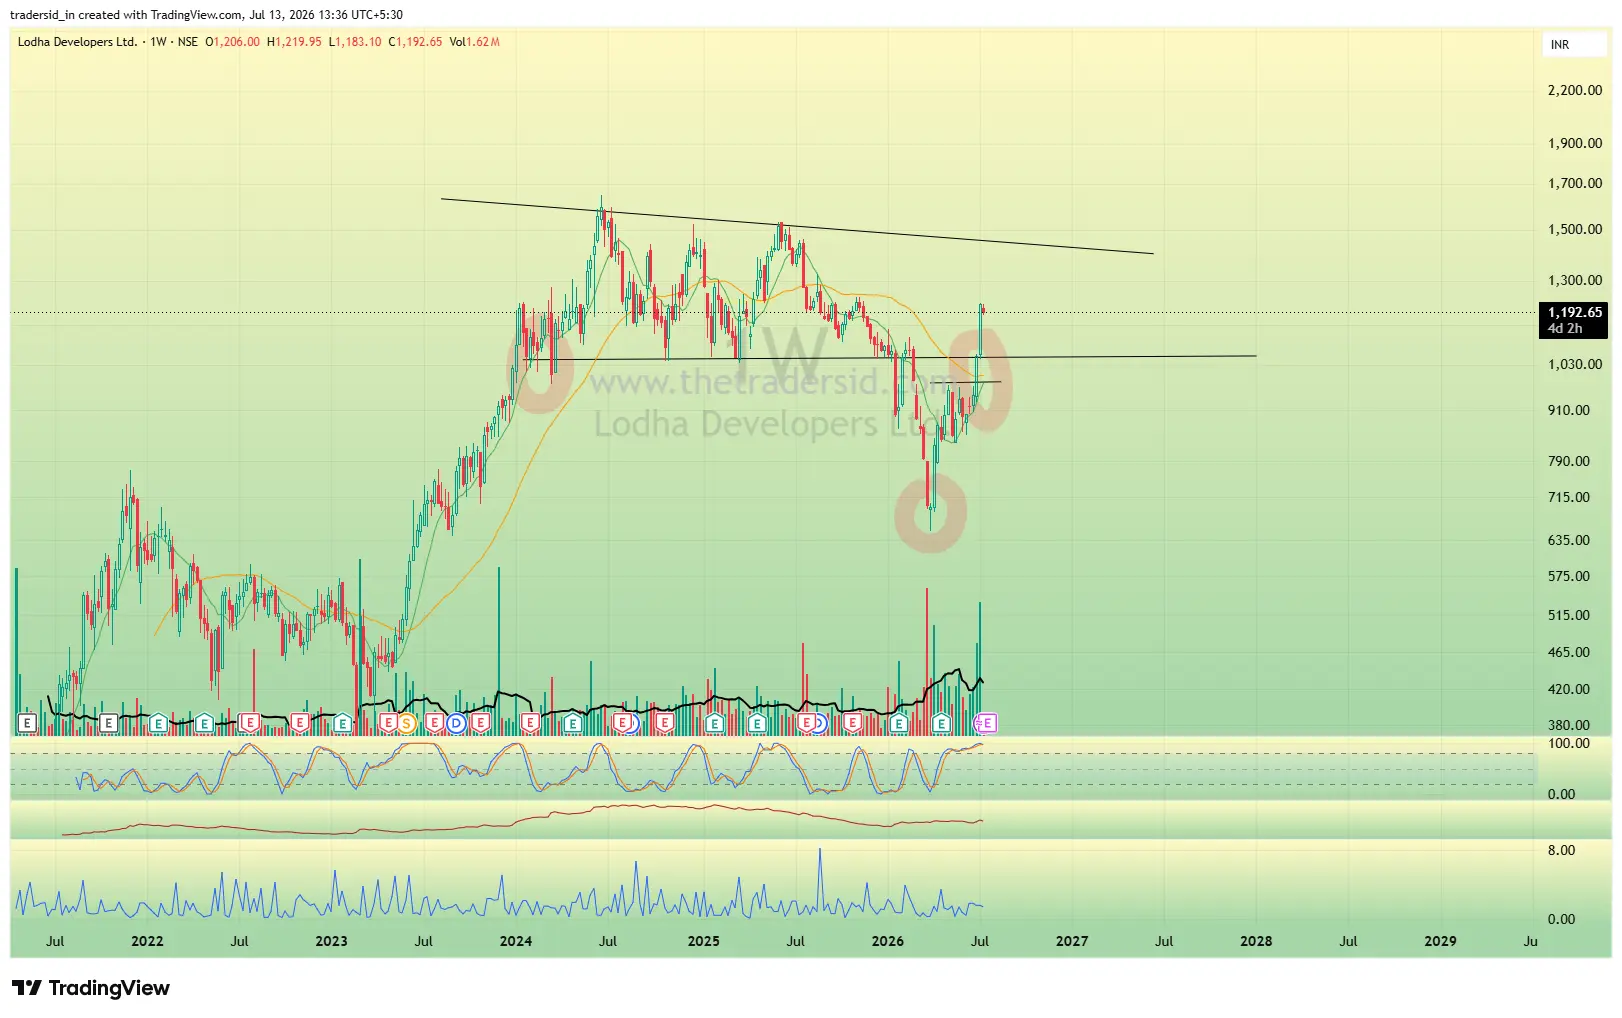
On the weekly chart, the 10-week moving average has started curling upward and is closing in on the 40-week moving average from below. This crossover has not happened yet. It is close, but close is not confirmed.
This is the crux of why we are calling this a watch, not a trade. A 10-over-40 week crossover on a stock that has already reclaimed a major structural level is exactly the kind of confirmation signal our triangle setup looks for. Until it prints, we are not positioned.
Reading the price structure
Zoom out on the pattern of highs and lows and the structure supports the bullish case. Lodha has been printing higher highs and higher lows since the reversal off the yearly low, which is the basic definition of an uptrend and the backdrop we want in place before a triangle breakout has real odds behind it.
If the moving average crossover does confirm, the measured move from a pattern like this would point toward a retest of the stock’s prior swing highs. We are not going to pin a number on it here. The point is the structure, not the destination.
The caution flags
Two things are keeping us on the sidelines despite the constructive structure.
First, RSI is running hot and is already sitting in overbought territory. Momentum indicators at extremes can stay extreme for a while, but entering fresh into an overbought reading without a confirmed trigger is how you end up chasing a move that pauses right after you buy it.
Second, volume has been running above average as the stock has approached this zone, which is a genuine positive, but it needs to be paired with the price and moving average confirmation, not read in isolation.
The daily chart adds a wrinkle
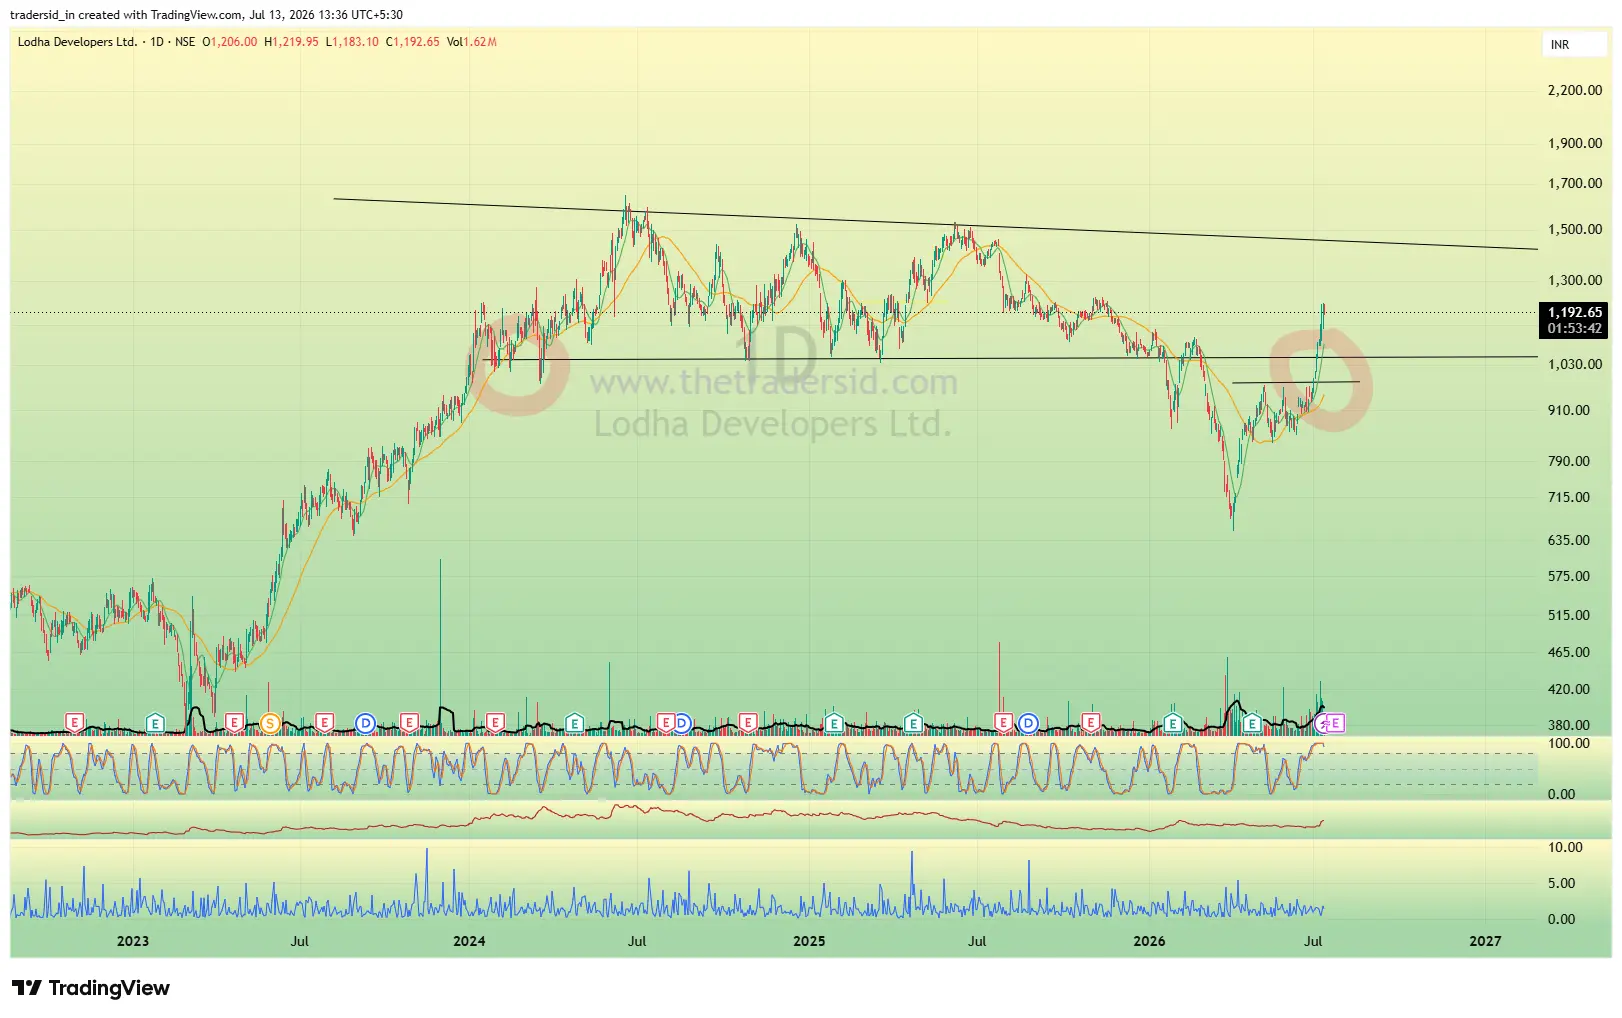
Drop down to the daily timeframe and Lodha is sitting inside a sideways range that actually traces back to January 2024. The stock has cycled in and out of this zone multiple times since then without a clean resolution. That is useful context because it tells us the weekly triangle is not happening in a vacuum. There is a multi year band of supply and demand here that the stock still needs to work through, even if the weekly structure looks constructive.
This is part of why we are not in a hurry. A weekly breakout with a confirmed moving average crossover is a stronger reason to act than a weekly breakout alone, especially when the daily chart shows the stock has failed to hold breakouts from this same broad zone before.
Where this leaves us
Lodha checks a lot of boxes. Reclaimed base, higher highs and higher lows, moving averages converging, volume picking up. What it does not have yet is the confirmed 10/40 week crossover, and RSI is already stretched enough that we would rather see a bit of digestion than chase strength into overbought conditions.
Bottom line: this is a stock we are actively tracking, not one we are trading yet. We will be watching for the weekly moving average crossover to confirm before this becomes an actionable setup. Until then, it stays on the watch list.
This article is for educational purposes only and does not constitute investment advice. We are not SEBI-registered advisors. Please do your own research or consult a registered investment advisor before making any trading decisions.