9 Stocks Worth Watching This Week
This week’s list draws most heavily from Realty and Pharma, in line with Sector Radar’s leadership findings, though strength this week is genuinely spread wider than those two sectors alone. Several stocks from Metal, Energy, Auto, and even IT, a sector that’s lagging overall, are showing individual strength strong enough to earn a spot despite their own sectors not confirming the same move.
LODHA
REALTY
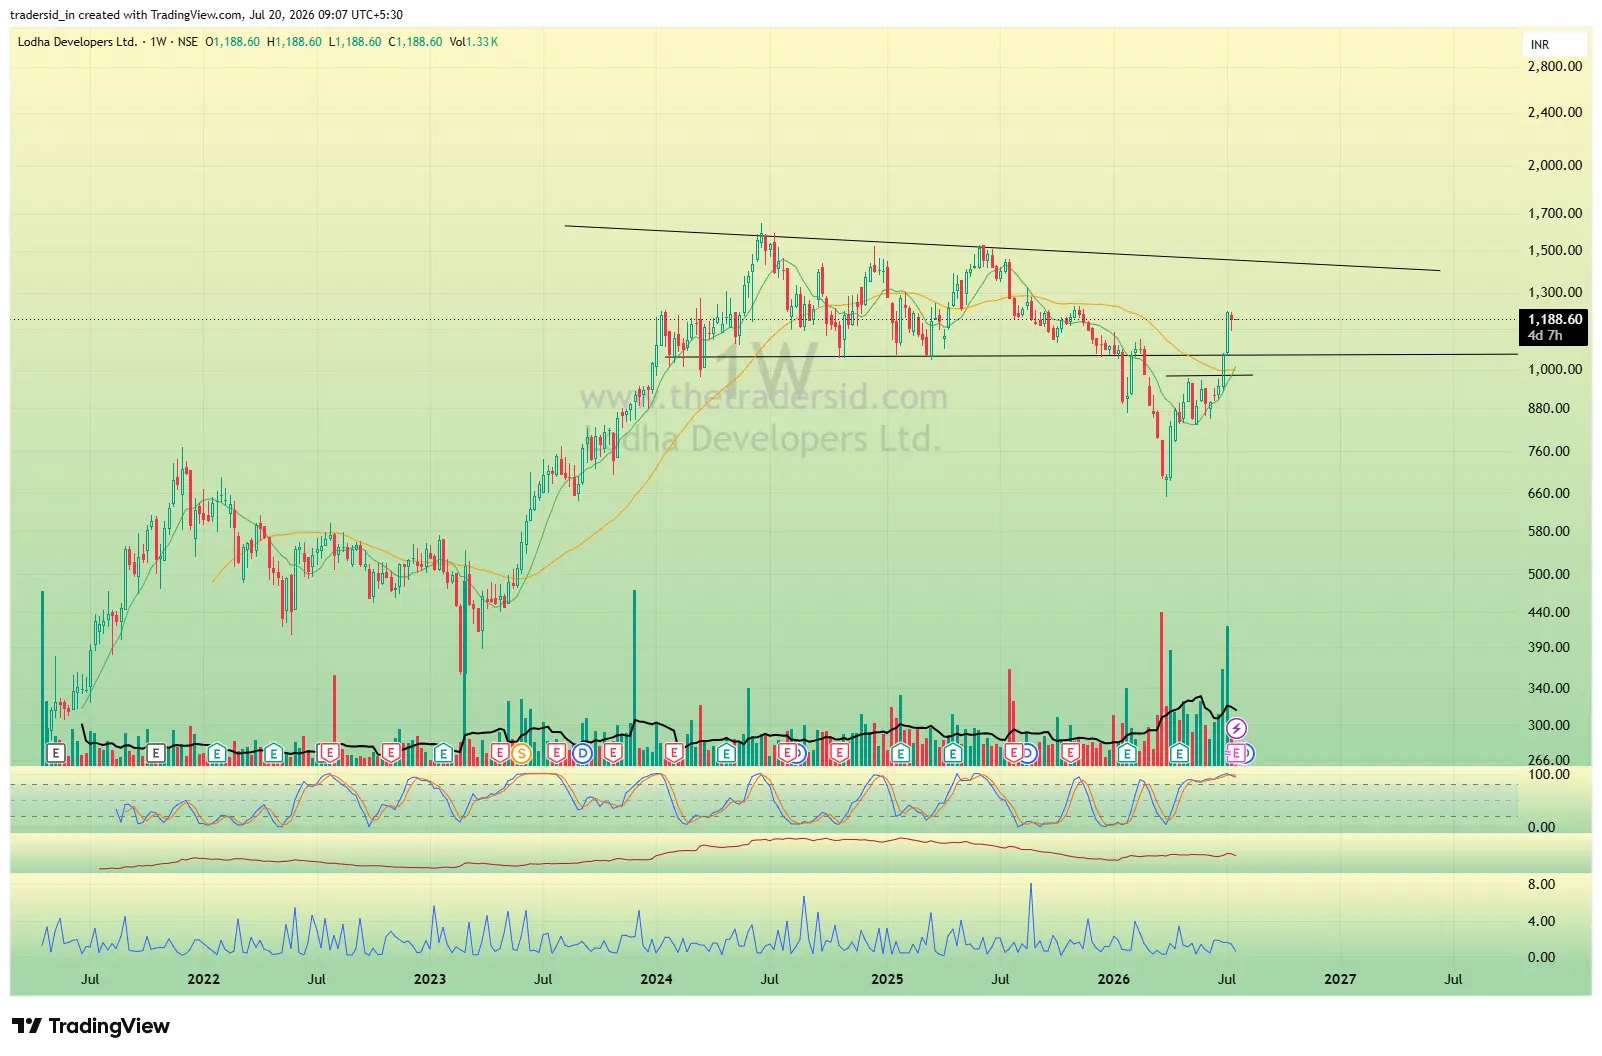
LODHA has broken above a shorter-term resistance shelf it had been consolidating under since early this year, with the one month gain backed by a strong three and six month rebound off its April lows. The move is meaningful, but it's still well below the longer downtrend line from its 2024 highs, so this looks more like a stage in an ongoing recovery than a full trend reversal. Worth watching whether it can build on this breakout or gets rejected back into the range it just left.
GODREJPROP
REALTY
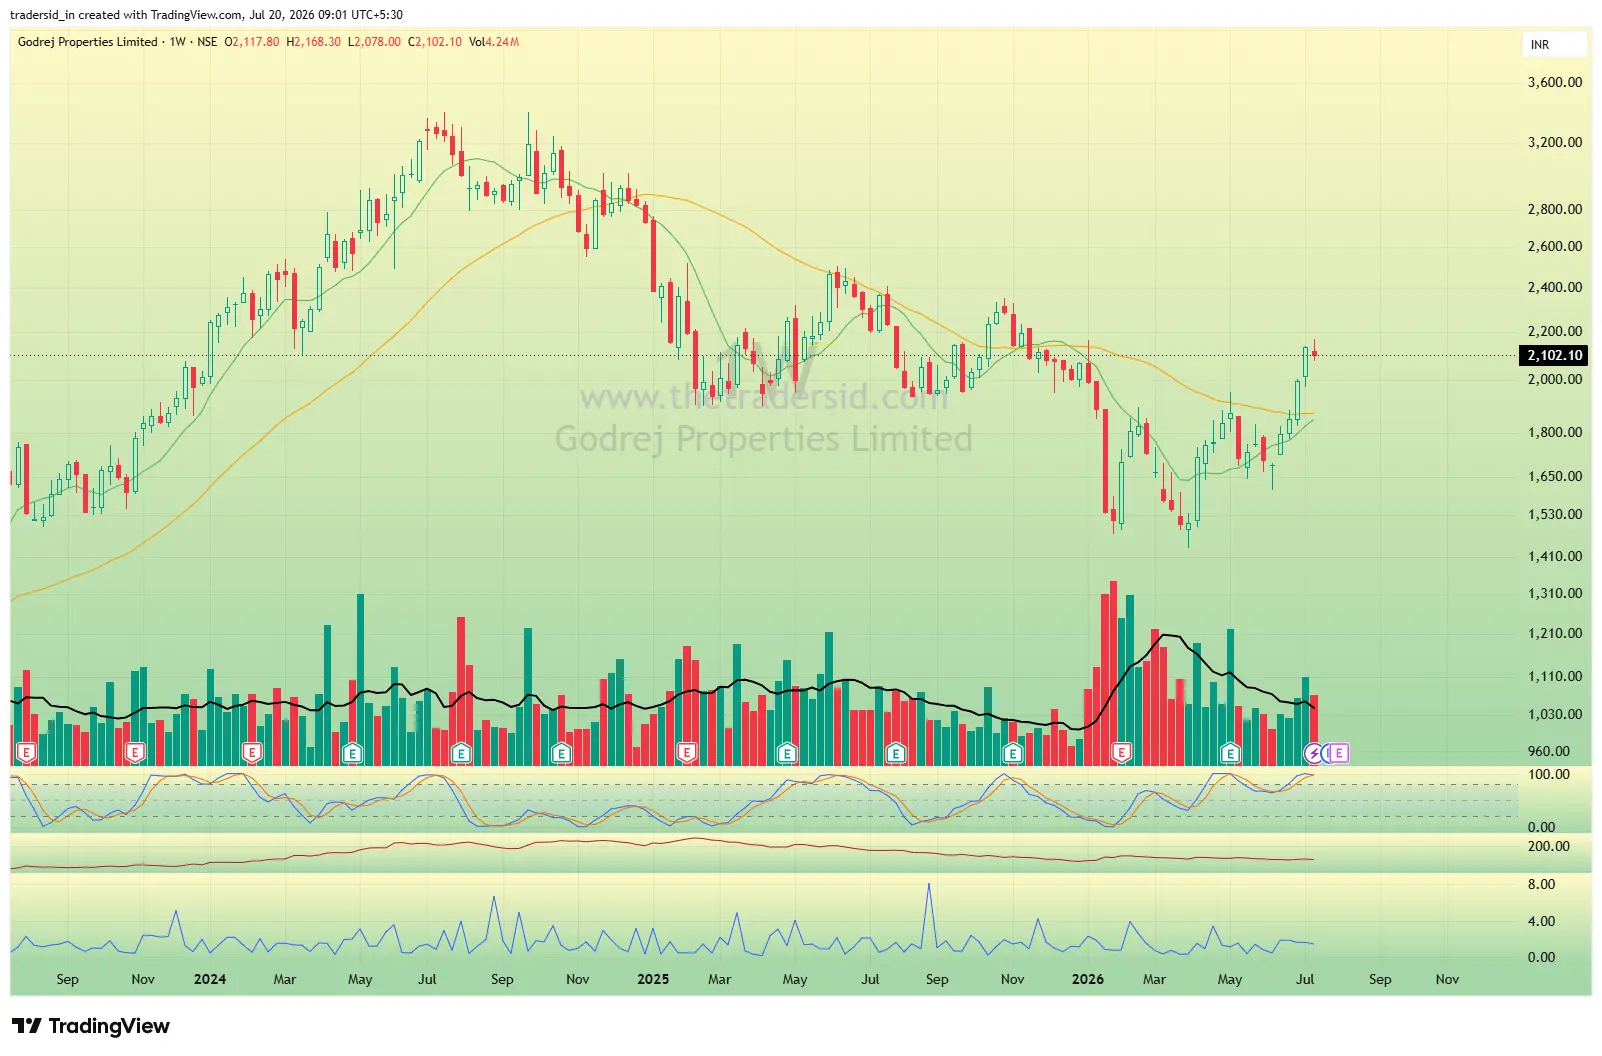
GODREJPROP is still in the early stages of its recovery, having just reclaimed its long-term moving average after a steep multi-month decline. The one month gain builds on a positive three and six month base, but the stock remains well below its prior highs, unlike some peers further along in their own recoveries. The key thing to watch is whether it can build on this reclaim or slips back below it.
LAURUSLABS
PHARMA
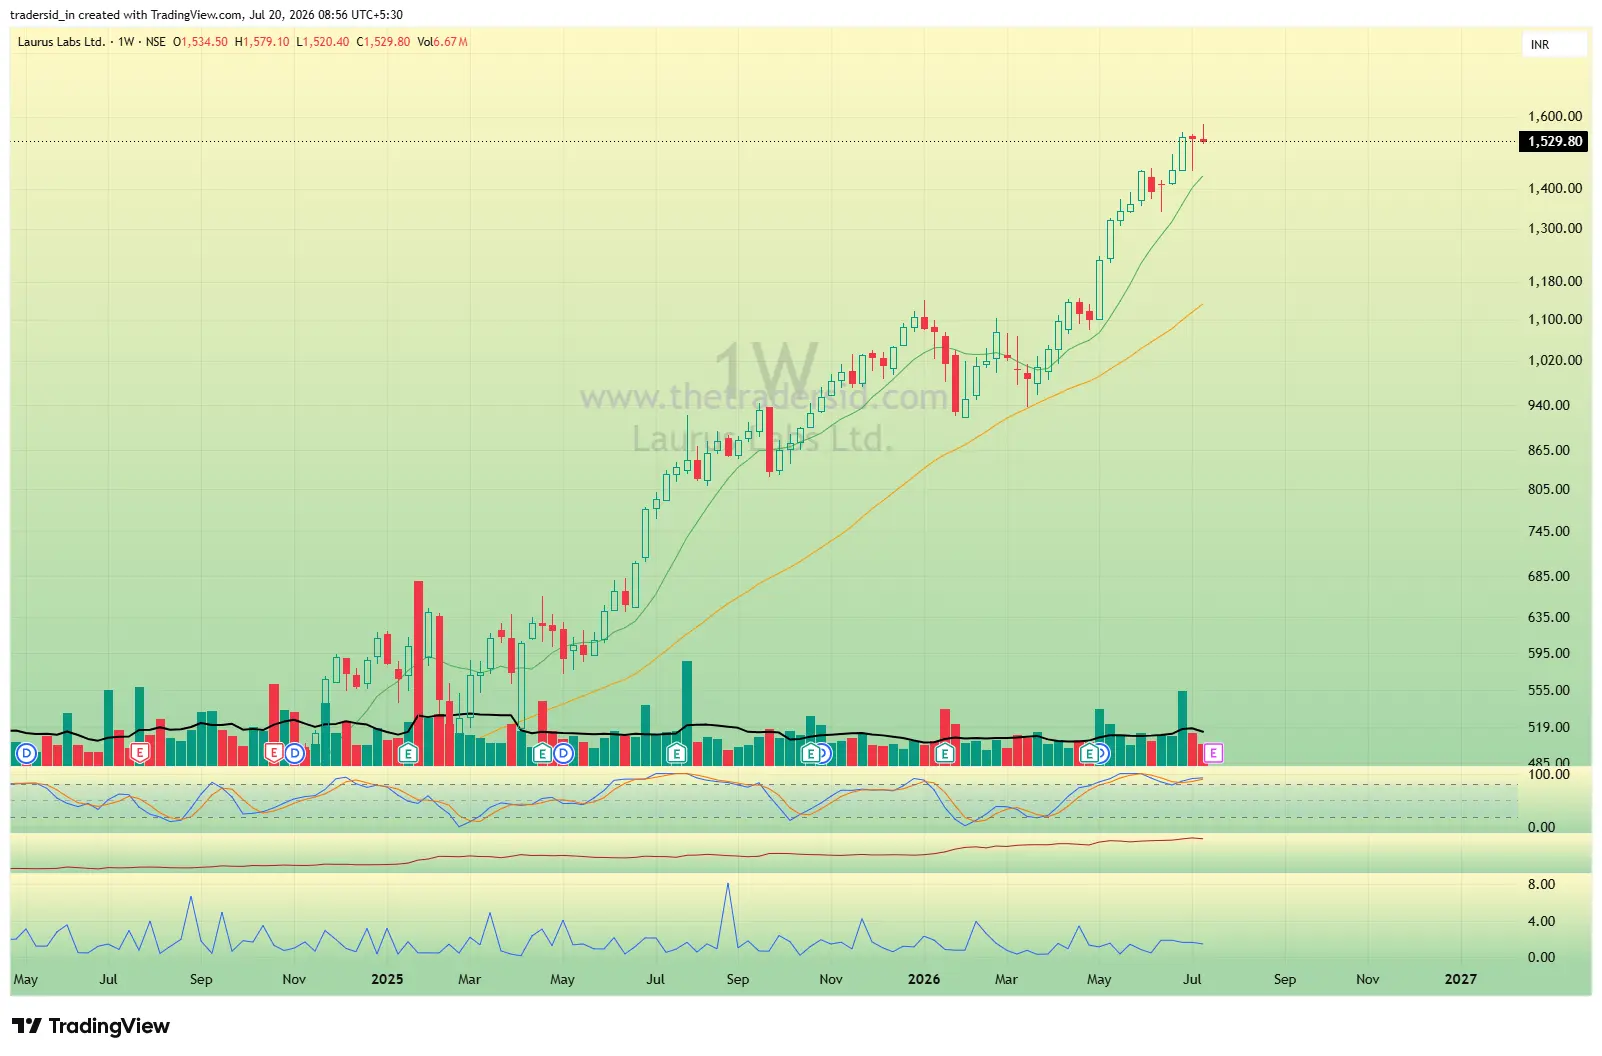
LAURUSLABS remains in a clean, established uptrend, trading above rising moving averages and making fresh highs with consistency rather than in sharp bursts. The steadiness here, backed by strong three and six month trends, fits the broader Pharma leadership picture this week. The next thing to watch is whether momentum can extend further from these highs or needs to pause first.
GLAND
PHARMA
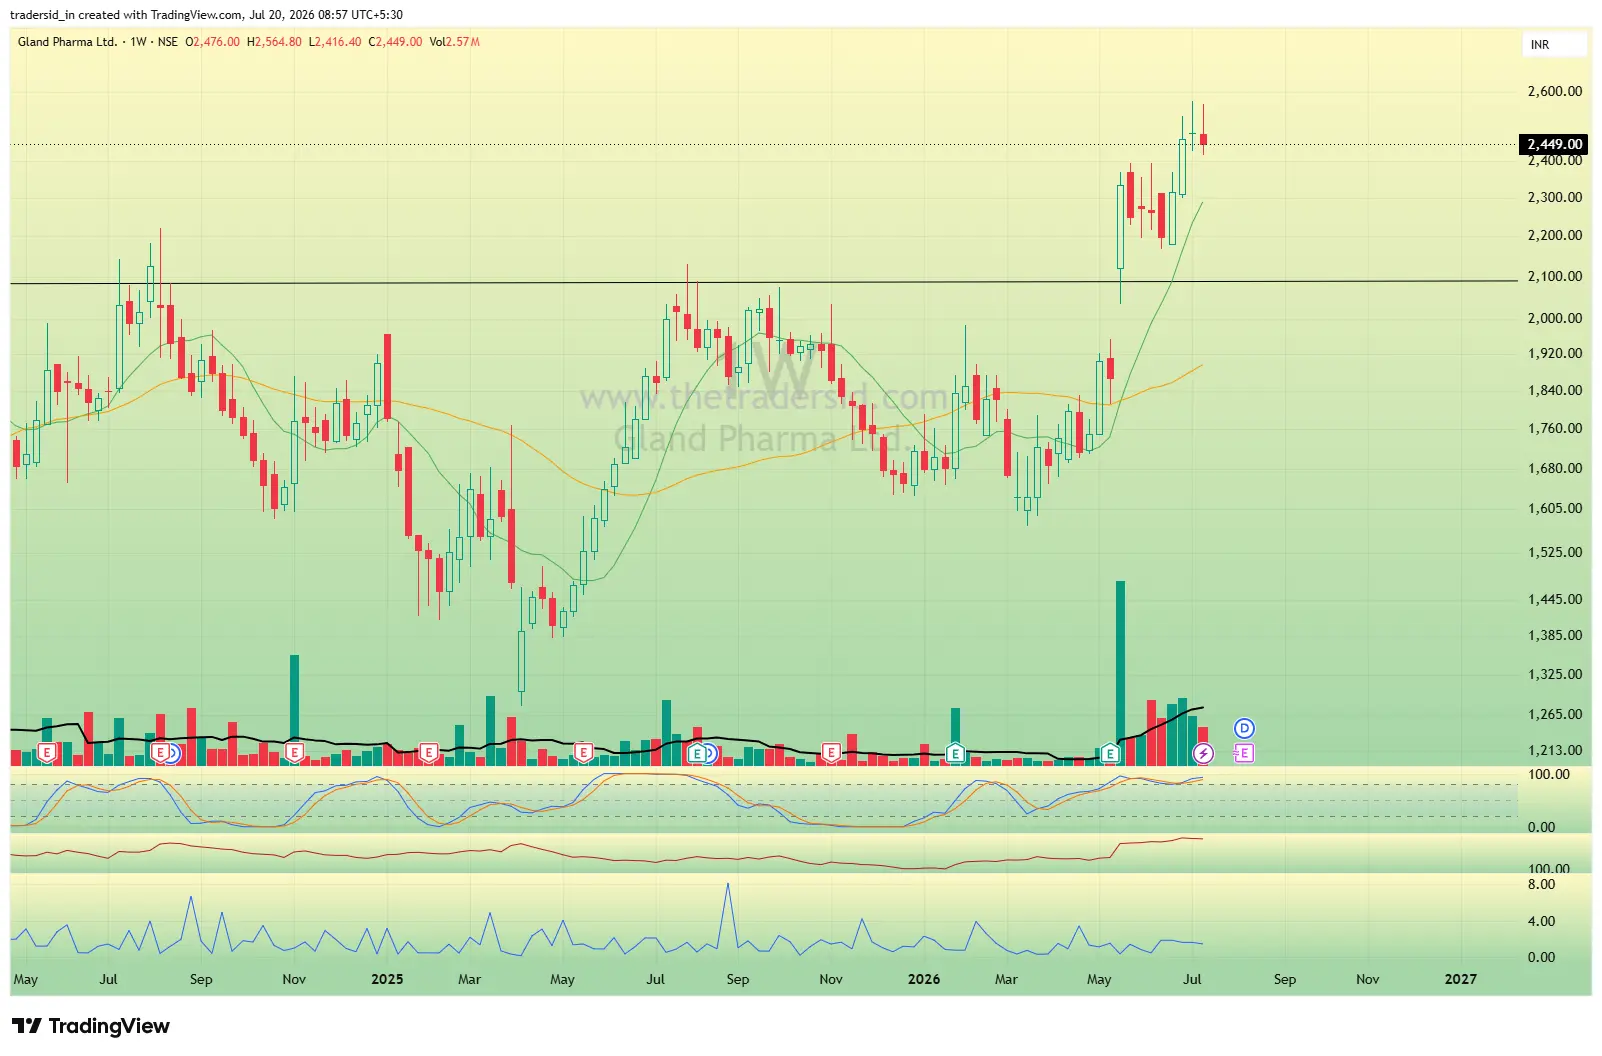
GLAND has broken out above a resistance zone that had capped it for well over a year, with the one month move confirming a three and six month trend that has been building steadily. This kind of breakout after a long consolidation often carries more weight than a move within an already-established range. Watch how it holds up on any pullback toward the newly broken level.
AEGISLOG
ENERGY
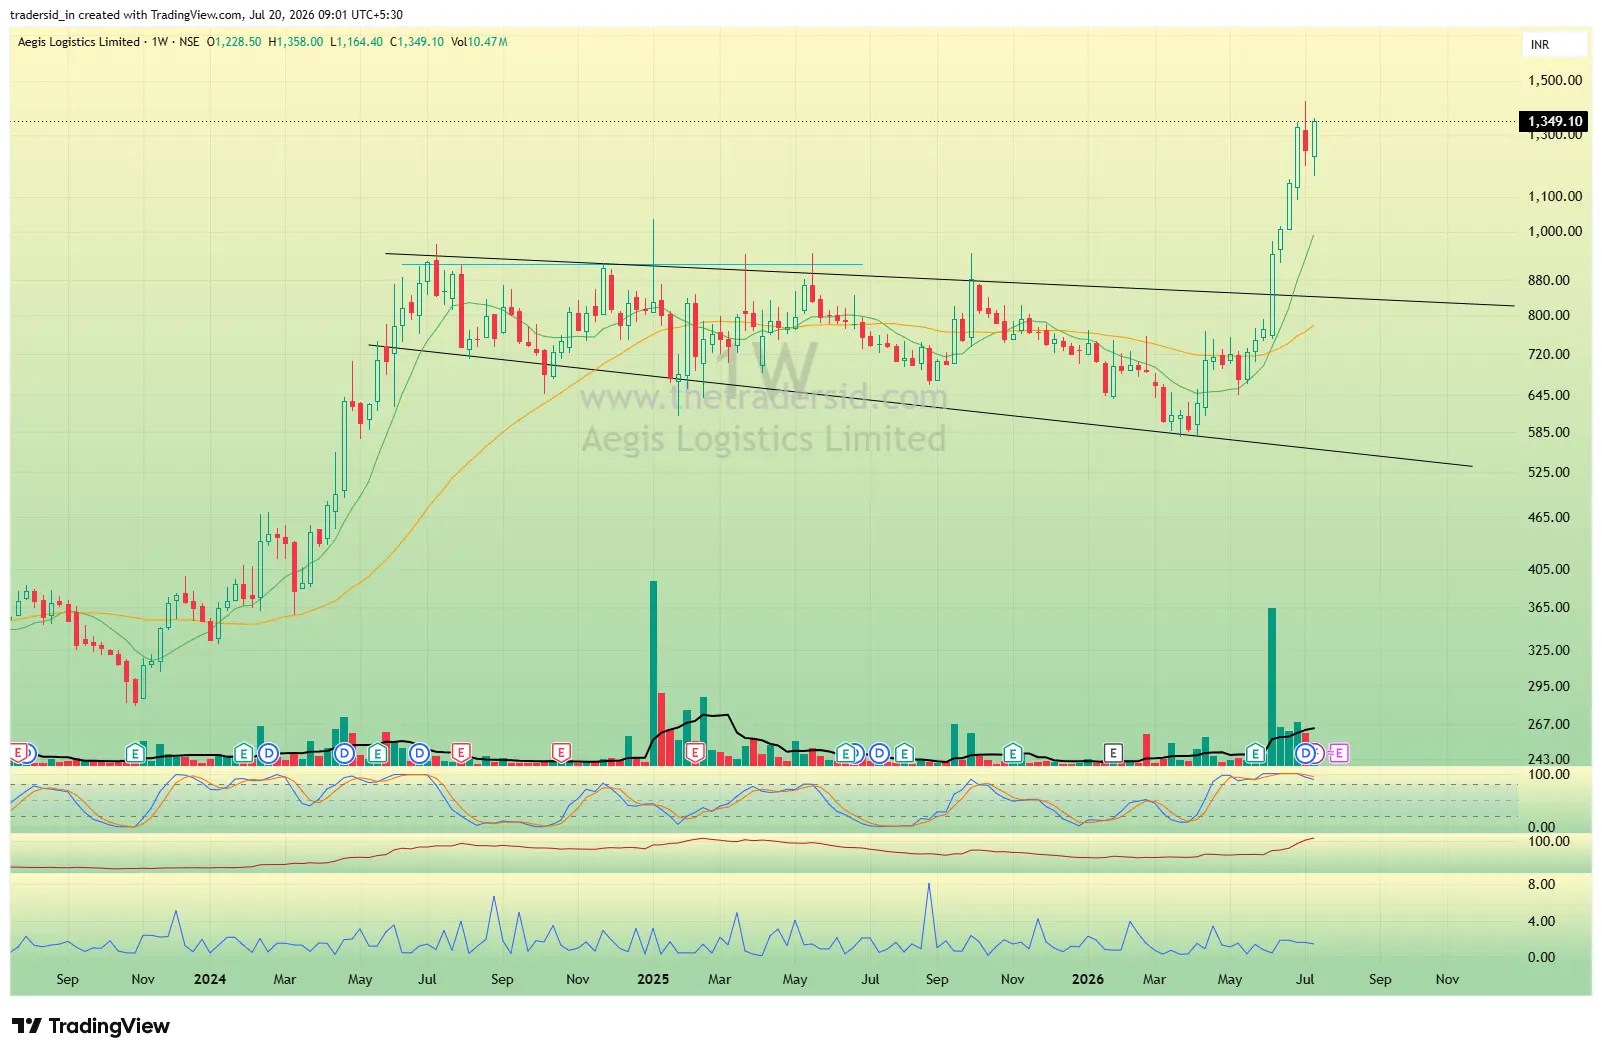
AEGISLOG is the standout individual mover on the entire sheet this week, breaking out decisively above a multi-year descending channel to hit fresh all-time highs. Its one month move builds on a three and six month trend that has been consistently strong, not a recent phenomenon. The key question going forward is whether it can hold this breakout or needs to retest the broken channel first.
ADANIENSOL
ENERGY
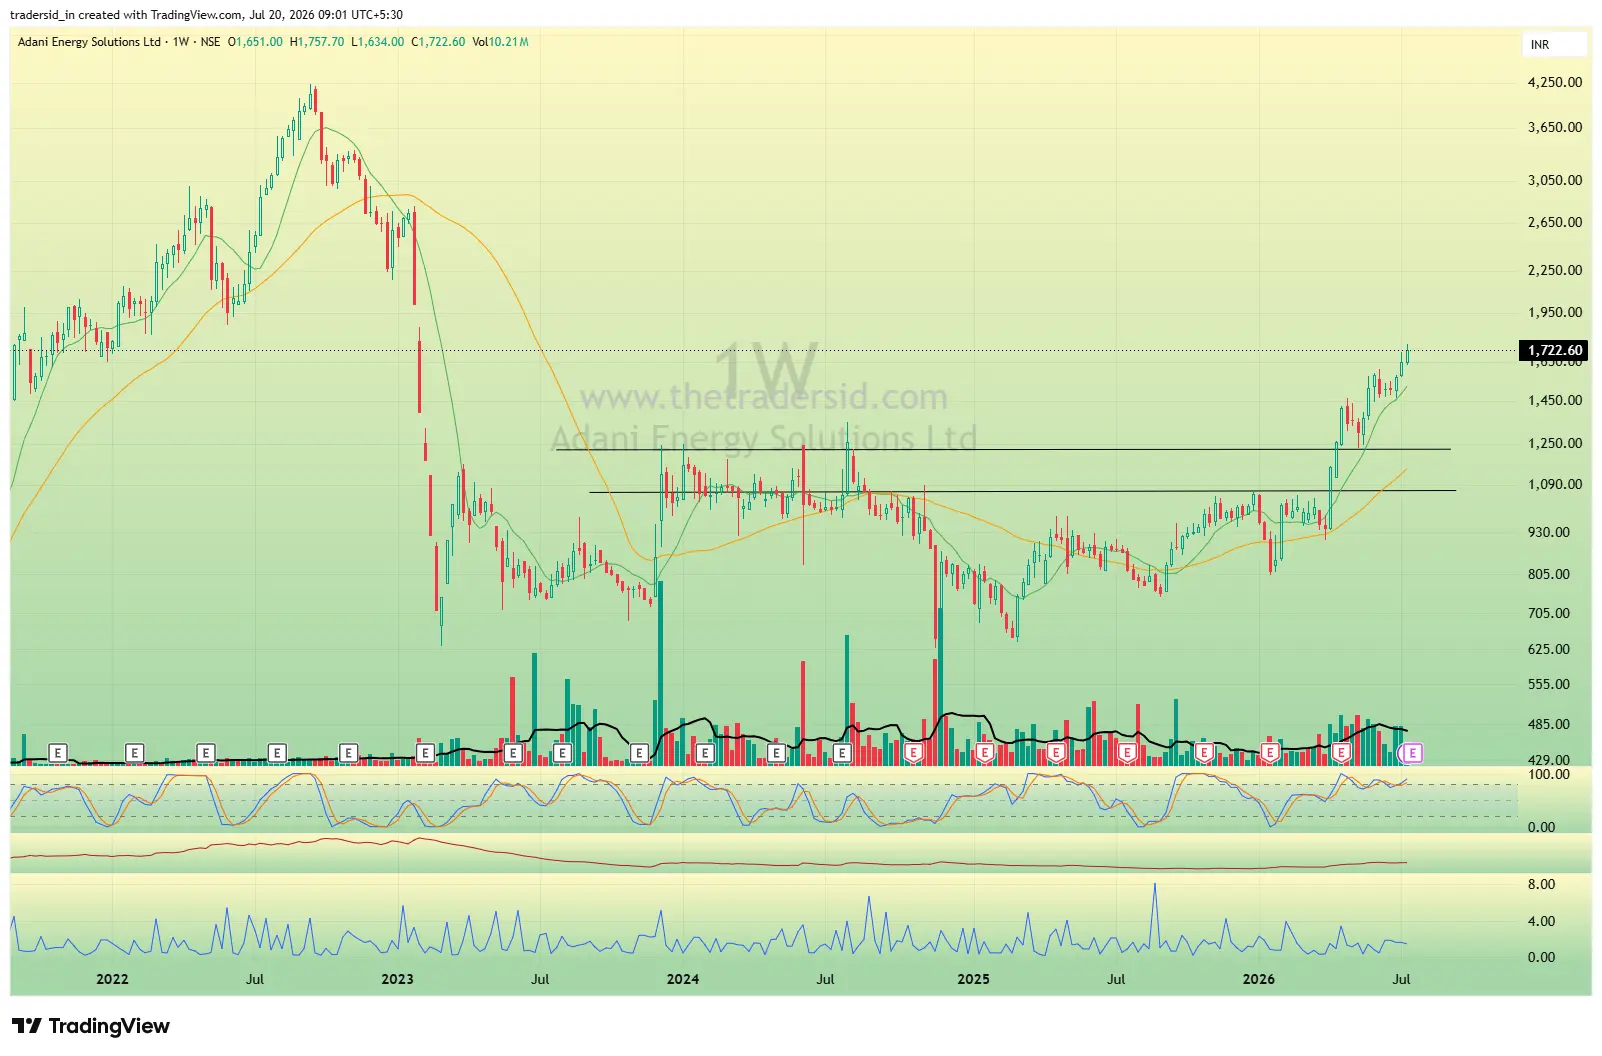
ADANIENSOL has cleared a resistance zone that held it in a range for roughly two years, with the one month gain sitting on top of an even stronger three and six month trend. This kind of breakout from a long base standing apart from Energy's broader softness this week suggests real underlying demand rather than a short-term bounce. Worth watching whether it continues to outrun its own sector or eventually gets pulled down with it.
WELCORP
METAL
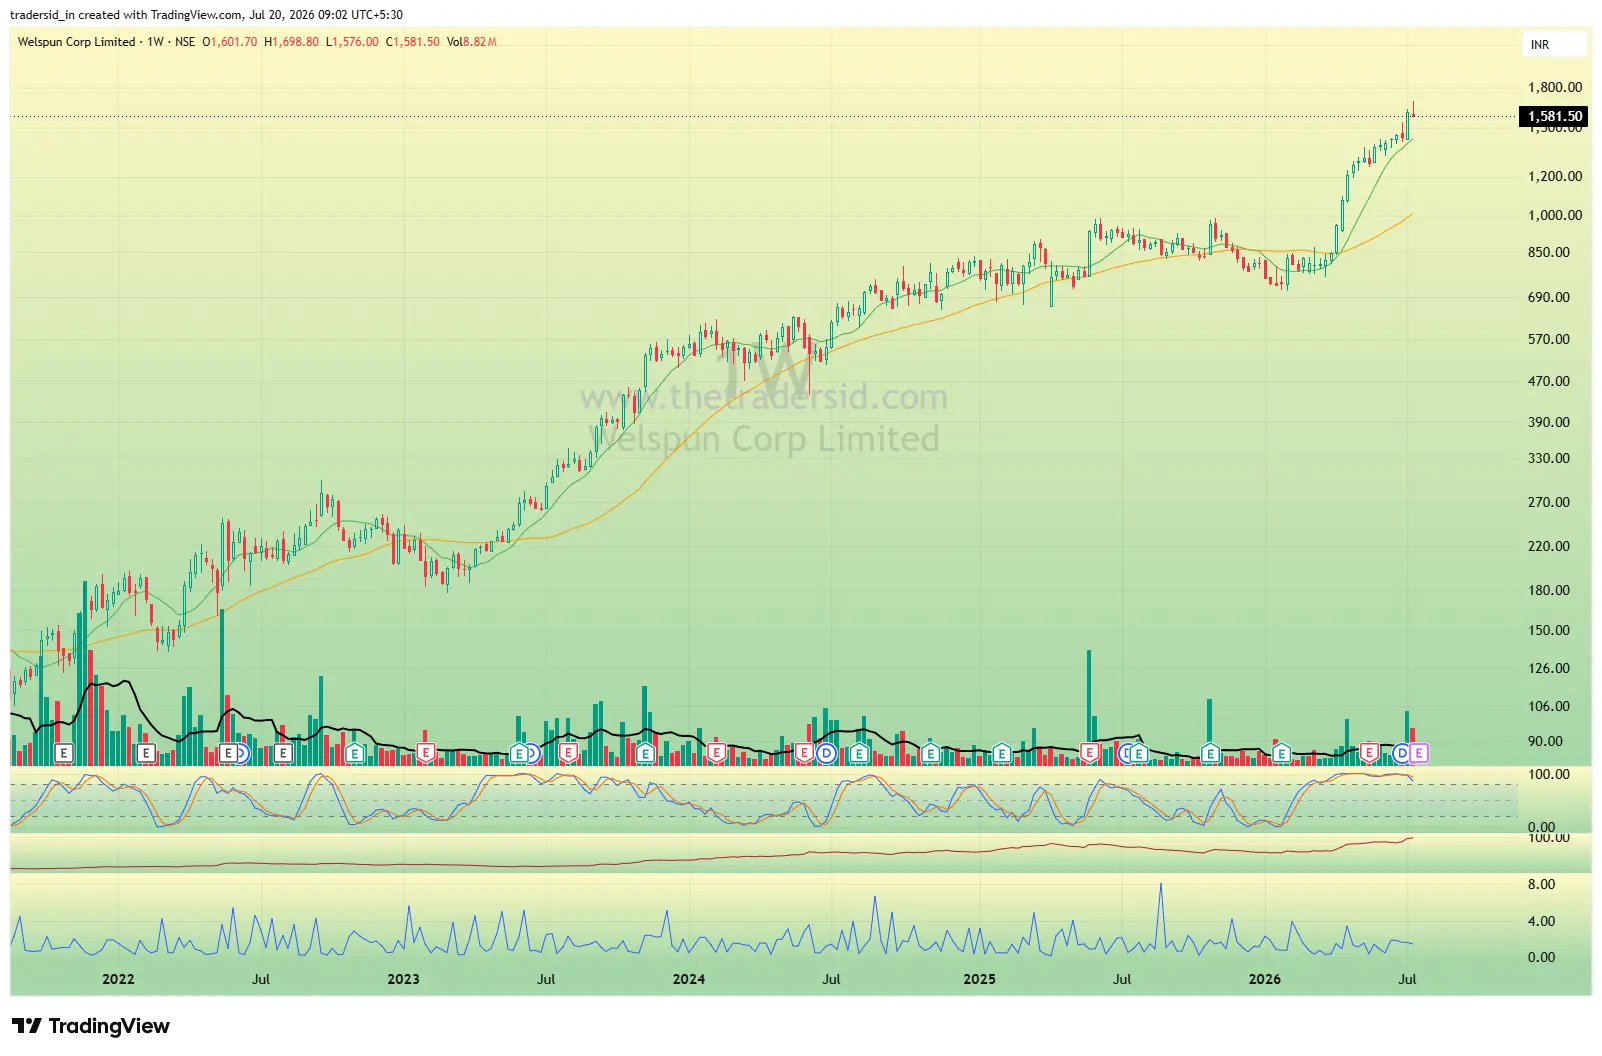
WELCORP has put in one of the strongest individual moves on the sheet, breaking out to fresh all-time highs after a long multi-year base. The one month gain sits on top of an even more powerful three and six month trend, and this kind of decisive breakout suggests real underlying demand rather than a short squeeze. Watch how it holds up if broader Metal sentiment stays mixed.
ADANIENT
METAL
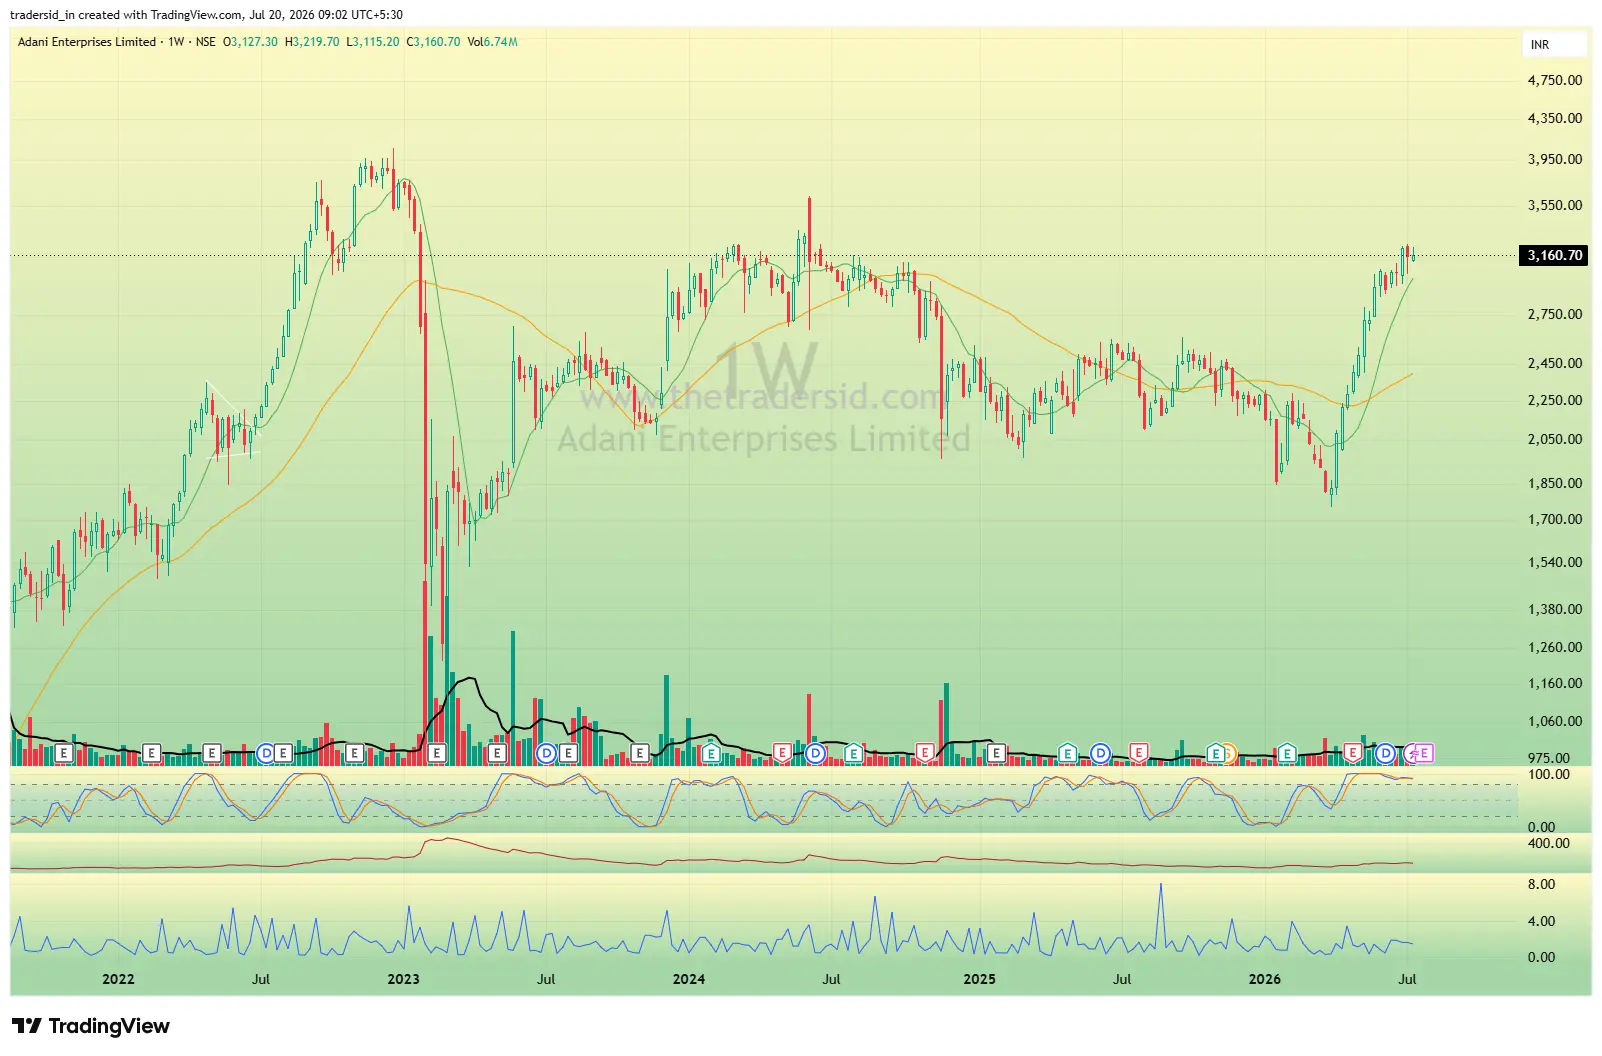
ADANIENT is recovering sharply off a deep multi-month decline, though it remains well below its 2024 highs, making this more of a bounce than a confirmed breakout. The three and six month trend is notably stronger than the one month figure, suggesting the stock has been building strength steadily beneath the surface. It's a name worth tracking for whether that longer-term base can translate into a more decisive move, or whether it stalls well short of prior highs.
OFSS
IT
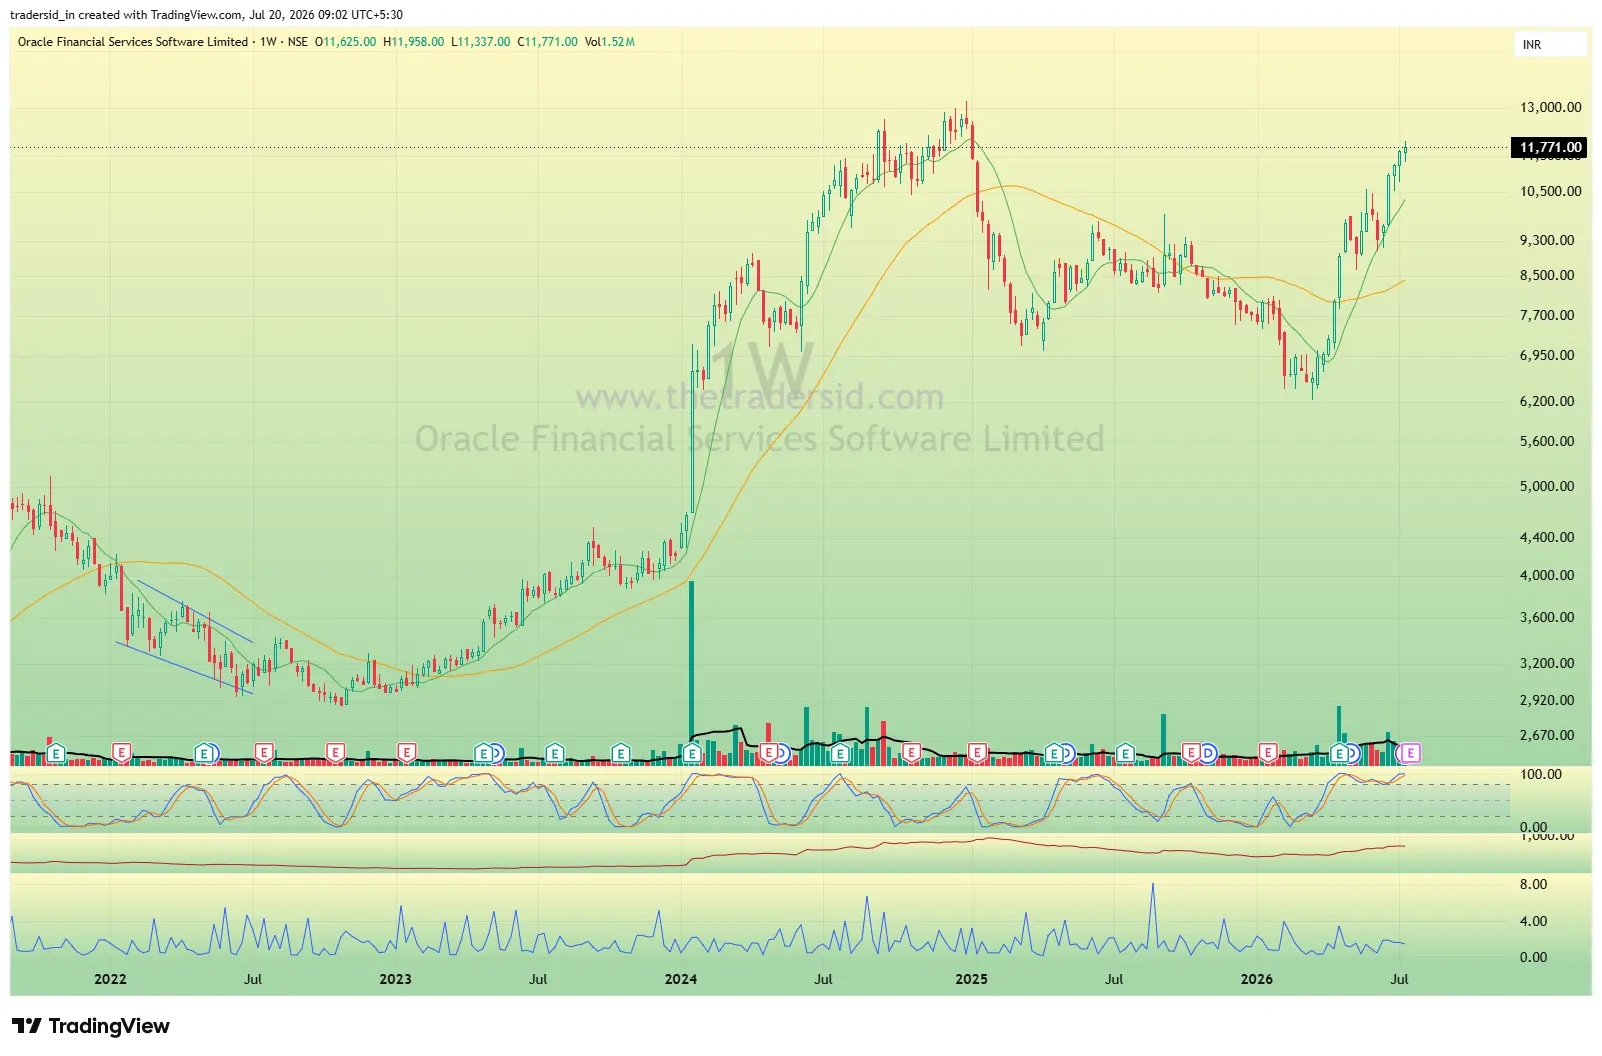
OFSS is a notable outlier given IT remains the weakest sector on the board this week, and it has broken out to fresh highs above its 2024-25 trading range. The one month gain sits on top of an even stronger three and six month trend, showing resilience that its own sector clearly isn't sharing. Watch closely whether this strength holds if IT weakens further, since sector headwinds could eventually catch up to even the strongest names within it.
SONACOMS
AUTO
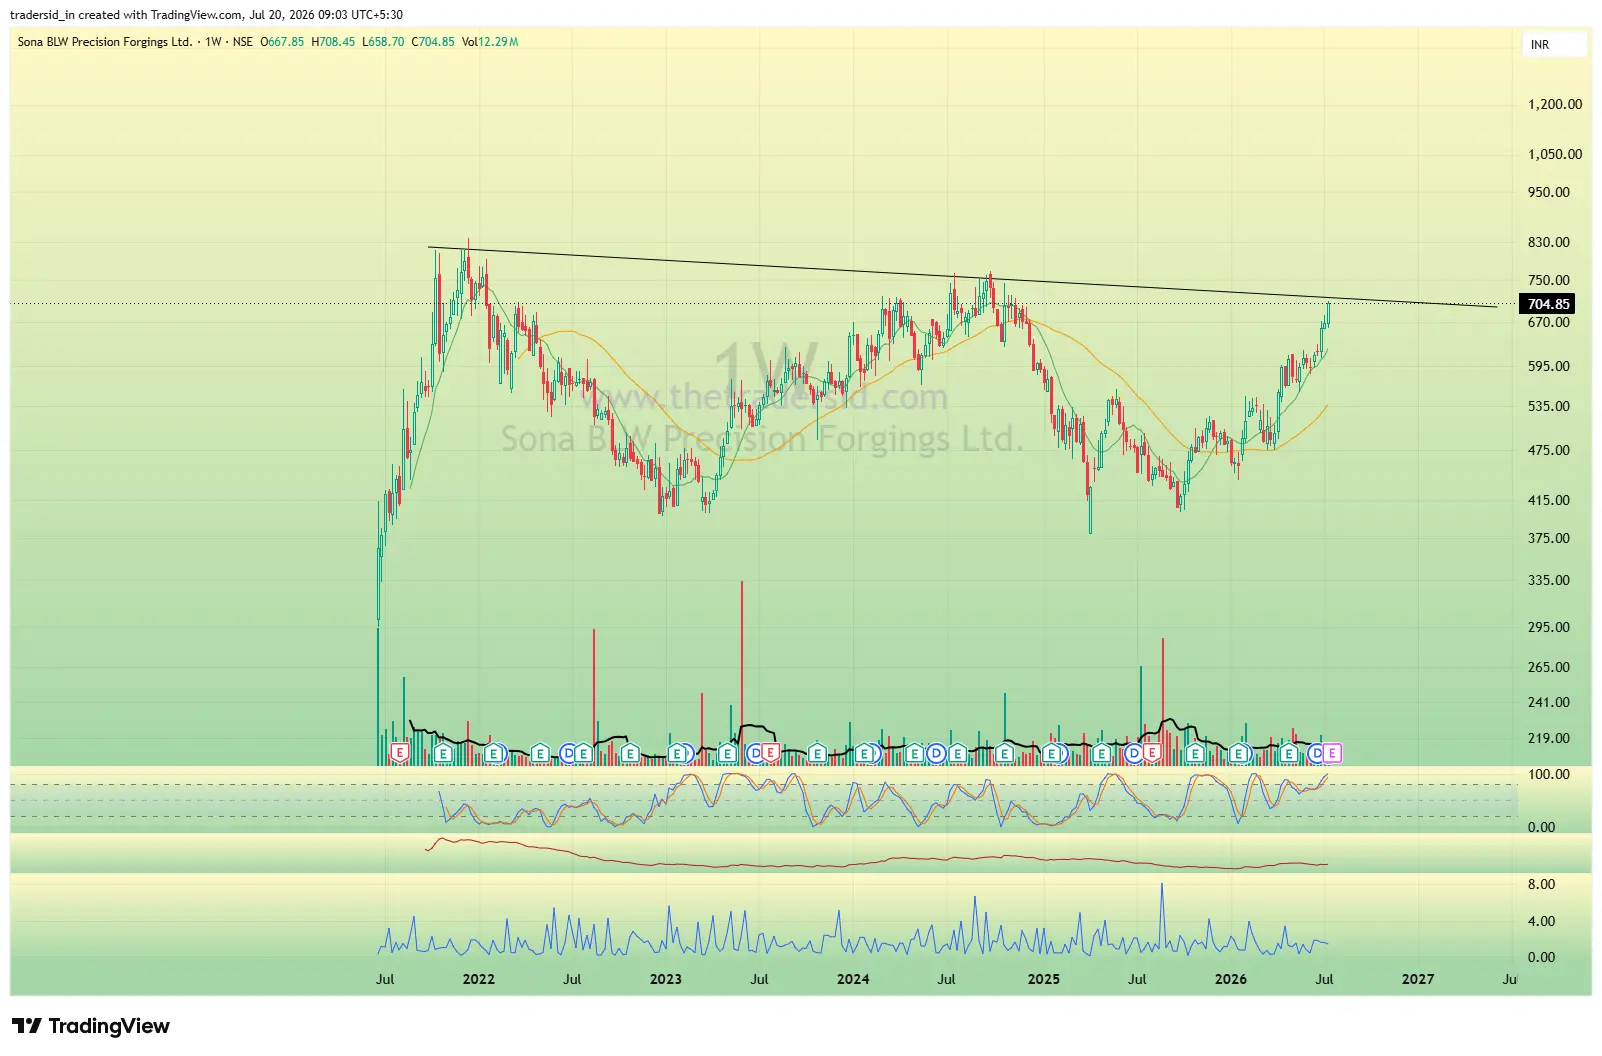
SONACOMS has posted a strong one month move that builds on a decent three and six month trend, but it is currently testing a long-term descending resistance line it hasn't yet cleared. Auto as a sector hasn't been a clear leader this week, which makes this kind of individual strength worth tracking closely to see if it can actually break through this level or stalls here again.
Stocks featured in the Weekly Market Radar are selected for research and educational purposes only. They are not buy or sell recommendations.
Bottom line: Realty and Pharma each contribute two stocks, confirming genuine sector-wide participation in both, though the Realty names are still working through recoveries rather than clearing major resistance, unlike AEGISLOG and WELCORP which broke out to fresh highs this week. Five additional names from Energy, Metal, IT, and Auto earned a spot purely on individual strength that stood apart from their own sectors. ADANIENT and SONACOMS are still testing key levels rather than having confirmed breakouts of their own. As always, this list is a starting point for your own research, not a signal to act on directly.