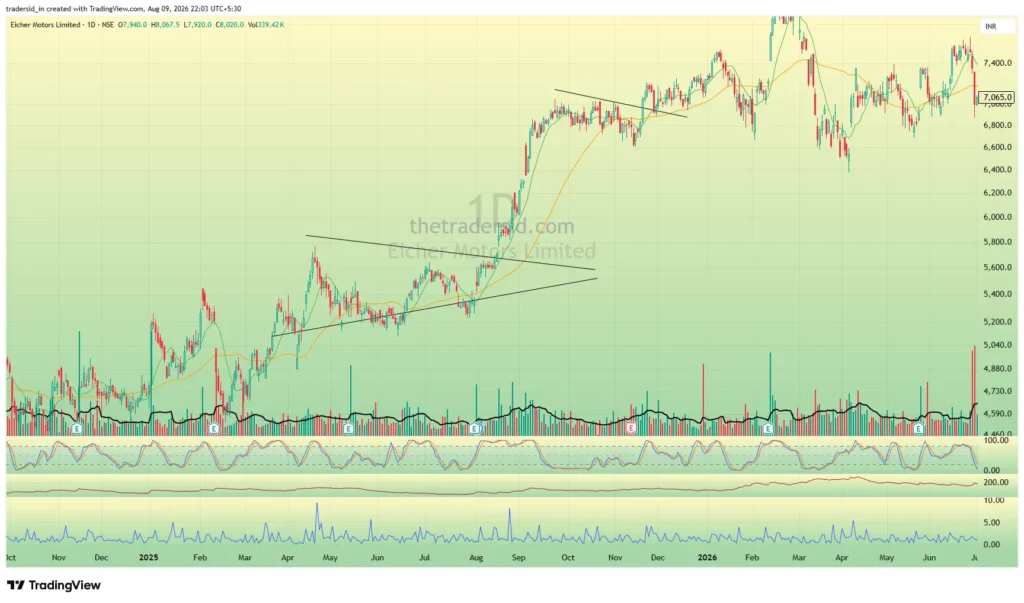
Most traders are trained to get excited when volume picks up. Heavy volume feels like something is happening, and it usually is. But some of the most reliable setups actually start with the opposite signature: volume fading to a crawl while price refuses to give ground. That quiet stretch, often overlooked because nothing dramatic seems to be happening, is one of the clearest tells behind a well-formed Triangle Pattern, and understanding why it matters changes how you read a consolidation long before it breaks out.
Why Quiet Volume Can Be a Bullish Signal
The instinct to chase high volume makes sense on the surface. Heavy volume means participation, and participation means conviction. But volume drying up during a consolidation tells a different, equally important story. When a stock has already had a real move, then settles into a tight range, and volume keeps shrinking the longer that range holds, it often means sellers have largely stepped away. There simply isn’t much supply left to sell.
This is the logic underneath a Triangle Pattern’s volume signature. Price tightens because buyers and sellers are reaching equilibrium, but a genuinely healthy tightening shows volume fading alongside it, not staying heavy. If sellers were still actively present in size, price wouldn’t be able to hold firm without volume, it would keep getting pushed around. Price holding steady while volume quietly fades is a sign that the remaining participants are largely in agreement, and it often doesn’t take much fresh demand to tip that balance and start a real move.
What This Looks Like Within a Triangle Setup
A Triangle Pattern worth watching typically shows a few things happening together, not any single condition in isolation.
The broader trend is intact. This is checked on the weekly chart first, the same way every setup in this system starts. A triangle forming within an established uptrend, particularly one supported by sector strength and relative strength against the broader market, carries far more weight than the same tightening pattern showing up in a stock with no real trend behind it.
Price holds above its key moving averages. As the triangle develops, price staying above the short and intermediate EMAs, rather than repeatedly losing them, reflects the same underlying idea as the volume signature: buyers are still in control even though the action looks quiet on the surface.
The range itself keeps tightening. Each successive swing within the pattern gets a little smaller, higher lows stepping up toward resistance, or a symmetrical narrowing on both sides. This is the visual signature of supply drying up.
Volume contracts as the range tightens. This is the piece most beginners overlook. As the triangle matures, volume should be shrinking toward some of the lowest levels the stock has seen in recent weeks. Quiet, unremarkable volume during this phase isn’t a sign of disinterest, it’s often a sign the setup is maturing properly.
The breakout itself comes with volume expansion. This is the payoff for the quiet phase. A genuine breakout from a well-formed triangle typically shows volume stepping up meaningfully compared to the contraction that preceded it. That expansion is what separates a real breakout from a false poke above resistance that fades right back into the range.
What Argues Against the Setup
Just as the presence of these signs builds confidence, their absence, or the presence of the opposite signs, is a reason to stay cautious.
A triangle where volume increases while price is actually falling within the range is a warning sign, not a confirmation. It suggests active selling rather than sellers stepping away. Wide, volatile candles showing up during what should be a quiet consolidation phase are another red flag, a genuinely tightening setup should look increasingly calm, not increasingly erratic. Price repeatedly losing a key short-term EMA during the pattern, rather than holding above it, suggests the buyers who were supposed to be in control aren’t as firmly in charge as the pattern requires. And if volatility is expanding rather than contracting as the pattern develops, the setup is behaving like the opposite of a healthy triangle, regardless of how the price levels look on their own.
Why the Quiet Phase Is Easy to Miss
Volume drying up doesn’t look exciting. There’s no dramatic breakout candle, no sudden spike to catch the eye while it’s happening. This is exactly why the setup gets overlooked by traders who are scanning for action rather than scanning for structure. The stocks worth watching during this phase often look boring on a daily glance, small candles, shrinking volume bars, nothing that jumps off the screen.
This is also why weekly structure matters so much for identifying triangles in the first place. A pattern that’s taken several weeks to tighten properly, with volume fading in a genuine, sustained way rather than just one or two quiet days, reflects real accumulation playing out over time. Trying to spot this on a daily chart alone, without the weekly context, makes it much harder to tell a genuinely maturing setup apart from a stock that’s simply stuck in a random range.
The Bigger Point
High volume tells you when buyers or sellers are clearly active. Low volume, in the right context, tells you when one side has largely stepped away. Both pieces of information matter, and reading them together is what separates a Triangle Pattern worth watching from a random consolidation that happens to look similar on the surface. The setups that eventually produce the most convincing breakouts are often the ones that looked the quietest right before they moved, which is exactly why the volume dry-up phase deserves attention rather than being scrolled past in search of something louder.