Every swing trader eventually learns the same lesson the hard way. Your setup can be perfect. Your entry can be textbook. Your risk per trade can be exactly 1% like it should be. And you can still bleed money, not because the setup failed, but because you were fighting the wrong market.
A Triangle breakout that works beautifully in a trending market can fail three times in a row during a choppy one. Same pattern, same rules, same discipline. Different outcome. The difference isn’t your setup. It’s the environment you’re placing it in.
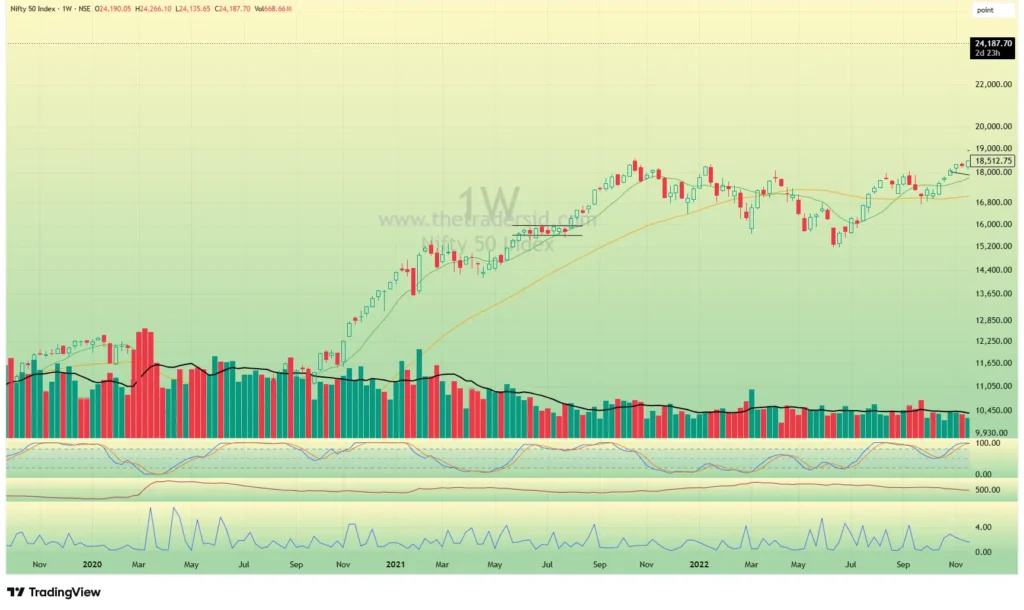
So before I decide how many new positions to take, or how large to size them, I check one thing first. Not a stock. Not a sector. The Nifty weekly chart itself.
Why The Index, Not The Stock
Every individual stock setup lives inside a bigger current. A Triangle on a strong stock in a strong market tends to resolve up and follow through. The same Triangle in a market that’s chopping sideways tends to fake out, tag your stop, and reverse. The pattern didn’t change. The water it’s swimming in did.
This is the part most swing trading education skips. Everyone teaches you how to find the setup. Almost nobody teaches you when to trust it less. The Nifty weekly chart is how I answer that second question, and it costs nothing but a glance.
What A Strong Market Looks Like On The Weekly
When Nifty is trending, the weekly candles tell you plainly. Each week tends to make progress. Highs extend beyond the prior week’s high, or lows hold above the prior week’s low. The candles have body to them. They don’t overlap much. You can look at four or five consecutive weekly candles and see a staircase, not a pile.
This is when I stay aggressive within my existing risk framework. Full position sizing up to my 20% capital cap per position, taking Triangle, HTF, and Gap Up setups as they qualify, not second-guessing entries that meet criteria. The market is doing the work. My job is to not get in its way.
What Fading Momentum Looks Like
The first warning sign isn’t a crash. It’s boredom. Weekly candles start overlapping. This week’s range sits inside last week’s range, or close to it. You get a string of small-bodied candles with long wicks both directions. The staircase flattens into a pile.
This is Nifty telling you the trend that was paying you is running out of participants willing to push it further. It doesn’t mean reverse everything and go to cash. It means the odds on new entries just got worse, even though your setups still look technically valid on individual stocks.
My response here is specific, not vague caution:
- Cut new position size. If I’d normally size toward the upper end of my risk budget, I size toward the lower end instead.
- Get more selective. A Triangle that would have qualified two weeks ago needs to look cleaner now to earn a position.
- Stop forcing trades to fill a quota. If nothing qualifies this week, nothing qualifies. Cash is a position.
What A Fully Choppy Market Looks Like
Sometimes it goes past fading and into genuinely out of sync. No clear range, no clear direction, whipsaws in both directions inside the same week or two. This is where I stop opening new positions entirely, regardless of how good an individual setup looks on a stock chart.
This is the hardest discipline to hold, because your scanner will still surface setups. The chart pattern doesn’t know or care what the index is doing. But a Triangle breakout attempted into a directionless index is a coin flip wearing a strategy’s clothes. Skipping it isn’t missing an opportunity. It’s refusing a bad bet.
The Signal To Come Back In
Standing aside only works if you have a clear trigger to stand back up. Otherwise caution turns into permanently sitting out every pullback, which is its own way of losing.
The trigger is the range itself. While Nifty chops, it’s building a range on the weekly, a defined high and a defined low across those overlapping candles. I wait for a decisive close beyond one side of that range.
- A close above the range high is my signal that buyers have taken control again. Aggression comes back on. Position sizing normalizes, new setups get taken at full conviction again.
- A close below the range low confirms the opposite. It tells me the chop was distribution, not accumulation, and that caution was correct. I stay defensive.
Either way, the breakout resolves the ambiguity. I’m not guessing which direction the market picks. I’m waiting for it to show me, then acting on what it already told me.
Why This Matters More Than Any Single Setup
Position sizing and setup selection are supposed to be mechanical. 1% risk per trade, 1.25x ATR stops, minimum 1:2 reward to risk, 20% max capital per position. Those rules don’t change. What changes is how many times you pull the trigger and how much conviction you size with, and that’s a market-regime decision, not a setup-quality decision.
Most of the damage I’ve seen swing traders take, myself included, doesn’t come from bad setups. It comes from taking normal position sizes on decent setups during a market that had already told you, on the weekly chart, that it was out of sync. The setup wasn’t the problem. Ignoring the bigger picture was.
Checking the Nifty weekly before every decision to size up costs thirty seconds. Not checking it costs a lot more than that, spread out over a career, in the form of trades that technically followed every rule except the one rule sitting above all the others.
The next trend always pays better than the chop. The only skill required is recognizing which one you’re standing in before you commit size to it.