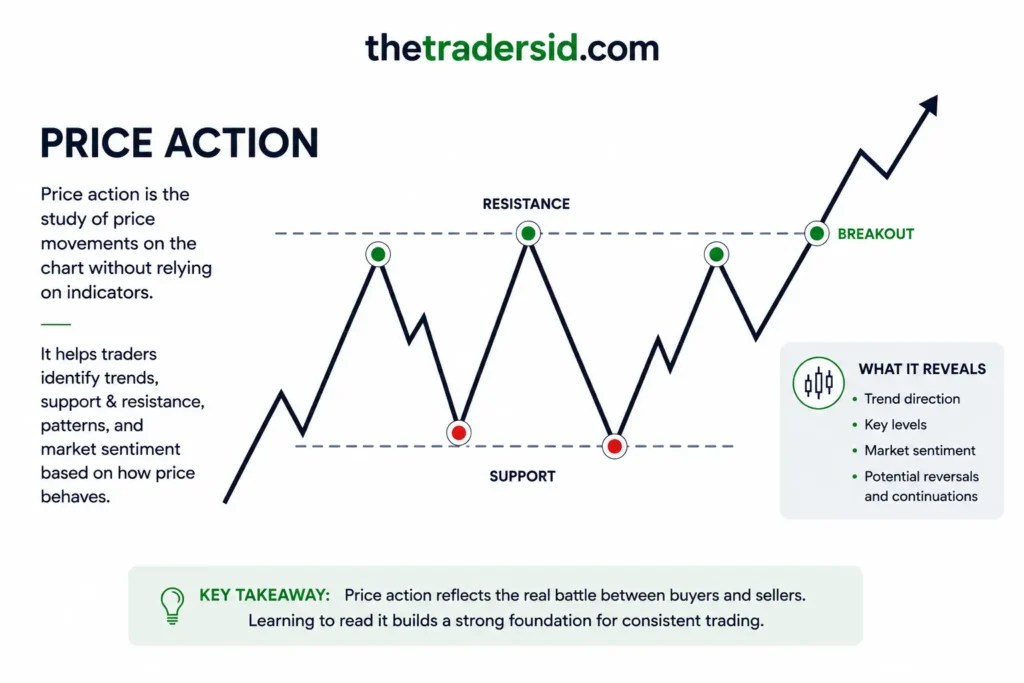
Ask a beginner to draw support and resistance on a chart and you’ll usually get a handful of horizontal lines connecting whatever swing highs and lows happen to catch the eye. Ask an experienced trader to explain why those levels actually matter, and the answer gets a lot more specific, and a lot less about drawing lines and a lot more about why price behaves the way it does around them. Few concepts in trading are used as often and understood as loosely as support and resistance.
What Support and Resistance Actually Are
Support is a price level where buying pressure has historically been strong enough to stop a decline and turn price back higher. Resistance is the opposite, a level where selling pressure has historically been strong enough to stop an advance and turn price back lower. That much is standard and mostly uncontroversial.
Where the confusion starts is in treating these as precise, almost magical lines that price respects with exact accuracy. In reality, support and resistance are better understood as zones reflecting where a meaningful number of market participants previously made decisions, rather than exact prices that will hold to the rupee every time they’re tested.
The underlying reason these levels matter isn’t superstition. At a genuine support level, a real concentration of buyers previously stepped in with real capital. Some of those same buyers, or others reasoning similarly, are more likely to act again if price returns to a similar area. At resistance, the reverse logic holds, a concentration of sellers or profit-taking previously capped the advance, and that memory tends to influence behaviour again on a retest.
Misunderstanding One: Treating Levels as Exact Lines
The most common mistake is drawing a support or resistance level as a single, precise price and expecting price to react exactly there, down to the last decimal. Markets don’t work with that kind of precision. A support level built around, say, 500, might see genuine buying interest show up anywhere from 495 to 505, depending on the stock’s volatility and how tightly it typically trades.
This is part of why ATR matters even outside of stop placement. A stock with a wider average true range needs a wider zone around any support or resistance level to be meaningful. Treating every level as an exact line, regardless of the stock’s typical volatility, is a major source of the “the level didn’t work” complaints that are usually really a measurement problem, not a failure of the underlying concept.
Misunderstanding Two: Assuming Every Touch Is Equally Significant
Not every prior high or low deserves to be marked as meaningful support or resistance. A level touched once, briefly, on a single day of unusual volatility carries far less weight than a level tested multiple times over several weeks, where price has clearly and repeatedly struggled to move beyond it.
This is where weekly chart structure becomes far more useful than daily-level noise for identifying genuinely significant levels. A level that has held or capped price across multiple weekly candles reflects sustained participant behaviour, not a single day’s overreaction. Beginners often mark every minor daily wiggle as a level, which results in a chart so cluttered with lines that almost any price movement can be explained by proximity to one of them, which defeats the purpose of using the concept at all.
Misunderstanding Three: Ignoring Volume at the Level
A level tested on heavy volume carries more significance than one tested on light volume, yet volume is frequently ignored entirely when traders draw support and resistance. A high made on unusually heavy volume, where a large number of participants transacted at that price, tends to leave behind a stronger psychological and structural mark than a high made on a quiet, low-volume day.
This connects directly to why breakouts and breakdowns confirmed by volume are treated so differently from those that aren’t. A breakout above resistance on strong volume suggests real conviction overwhelming the level. The same breakout on weak volume is far more likely to fail and fall back below the level shortly after, precisely because the participants who originally defended that level haven’t actually been overpowered, they simply haven’t shown up yet.
Misunderstanding Four: Support and Resistance Are Fixed Forever
Levels aren’t permanent fixtures. Their significance fades over time as the participants who originally created them exit their positions, change their views, or simply stop paying attention to that price. A resistance level from two years ago carries far less relevance today than one formed a few weeks ago, all else being equal, because market conditions, ownership, and sentiment have likely shifted substantially since then.
This is also where the well-known idea that old resistance can become new support, and vice versa, actually makes structural sense rather than being a coincidence. Once a resistance level is decisively broken with real conviction, the participants who previously sold at that level to cap the advance have largely been absorbed. A pullback to that same level afterward often finds new buyers, partly because breakout buyers who missed the initial move are willing to add on the retest, and partly because the level remains psychologically visible to everyone watching the chart.
Misunderstanding Five: Support and Resistance as a Standalone Strategy
Perhaps the biggest misunderstanding is treating support and resistance as a complete strategy on its own, buying every touch of support and selling every touch of resistance, regardless of broader context. This ignores trend entirely. A support level in a strong uptrend behaves very differently from a support level in a stock that’s been grinding lower for months. The first reflects a pause within ongoing accumulation. The second may simply be a temporary pit stop on the way to new lows.
This is exactly why support and resistance is most useful as one input within a broader framework, combined with weekly trend structure, EMA positioning, and volume, rather than as an isolated signal. A pullback to support that aligns with a rising weekly trend and a key EMA carries far more weight than a random support level tested in isolation, disconnected from everything else the stock is doing.
What Actually Makes a Level Worth Marking
Given all of this, a level is genuinely worth paying attention to when it reflects a meaningful concentration of past activity, tested more than once, ideally on the weekly timeframe, ideally with volume evidence behind at least one of those tests, and considered within the context of the stock’s broader trend rather than in isolation. A level that fails these tests is probably just a line drawn because it looked neat on the chart, not because it reflects anything real about supply and demand.
The Bigger Point
Support and resistance is one of the oldest concepts in technical analysis precisely because the underlying logic is sound, price levels where real capital previously changed hands do tend to matter again. The concept gets a bad reputation not because it’s flawed, but because it’s so often applied carelessly: drawn with false precision, marked without regard to volume or how many times a level was actually tested, and used as a standalone signal disconnected from trend.
Used carefully, as a zone rather than a line, weighted by how significant the historical activity at that level actually was, and combined with the broader trend and volume picture, support and resistance remains one of the more genuinely useful tools available. The concept isn’t the problem. The sloppy way it’s usually taught and applied is.