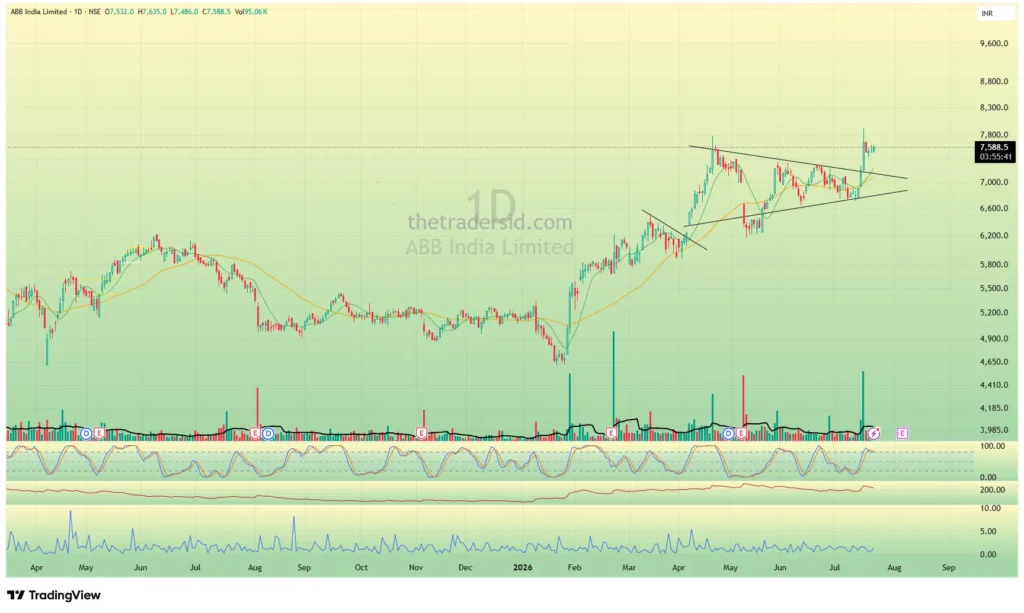
Most explanations of the Triangle pattern show you a clean, idealized diagram. Real charts are messier, and that’s exactly why they’re worth studying. ABB India’s recent chart is a good example of the pattern playing out with all its real-world texture, an extended uptrend, a multi-month pause, and a breakout that finally resolves the question the pattern had been asking. This is analysis of the setup, not a trade call or a recommendation to act on this specific stock.
The Move That Set It Up
Before any consolidation pattern means anything, there has to be a real move behind it. ABB India spent late last year in a decline, bottoming out in the 4,600 to 4,700 zone in February. From there the stock reversed hard, climbing in a strong, sustained advance that carried it to a high near 7,780 by May, more than 65% off the low in a relatively short stretch.
That kind of move matters for how you read what comes next. A Triangle forming after a sharp, extended advance like this is a different animal from a Triangle forming in a stock that’s been drifting sideways with no real trend behind it. The first is a pause within a trend that already proved it has real strength. The second is often just noise. Context always comes before pattern.
The Consolidation Takes Shape
After tagging that high, ABB India didn’t reverse hard. It rolled into a sideways range that stretched across roughly three months, May through July. Looking at the price action during this stretch, the highs came in progressively lower while the lows came in progressively higher, the classic signature of converging trendlines that defines a Triangle.
This is the part of the pattern that tests patience more than any other. For weeks, the stock did very little that looked exciting. It traded back and forth inside a shrinking range, giving up ground on the pullbacks but never breaking down, then rallying but never quite reclaiming the prior highs. Volume during this stretch was unremarkable, no big surges either direction, which is itself part of the story. A Triangle on shrinking, unremarkable volume is telling you supply and demand are roughly balanced, with neither side willing to commit until something forces the issue.
Why This Matters More Than It Looks
It’s easy to read three months of sideways chop as a stock that’s lost momentum. What the pattern is actually describing is closer to the opposite. Sellers who bought near the top of the initial advance are working through their positions, testing the market on every rally without being able to push price to new highs. Buyers, meanwhile, keep stepping in on the dips, refusing to let the stock give back much ground. Each test of the range produces a slightly tighter result than the one before it, which is the visual signature of a Triangle actually working the way the pattern is supposed to.
The Breakout
That balance can only hold for so long. This past week, ABB India broke decisively above the upper trendline that had capped every rally since May, pushing to a high of 7,635 and closing near 7,597.5, comfortably above the resistance that had held for months. The move came on a visibly larger range candle relative to the quiet consolidation that preceded it, the kind of expansion in range you’d want to see accompanying a genuine resolution of the pattern rather than a half-hearted poke through the level.
This is the moment a Triangle is built around. Everything before the breakout, the converging highs and lows, the shrinking range, the patience required to sit through it, exists to set up this single question: which side wins when the range finally breaks. Here, buyers answered it clearly, reclaiming the prior high from May in the same move that cleared the trendline.
What This Teaches About The Pattern Generally
A few things about this chart are worth carrying into how you read the next Triangle you find.
The pattern needed real time to develop. Three months of sideways action is a long time to sit and watch, and there’s no way to know in week four or week eight whether a Triangle will resolve up or down. The stock could just as easily have broken the lower trendline instead. Patience through the uncertainty is part of the setup, not a flaw in it.
The breakout mattered more than the anticipation. Buying into the middle of the range on the assumption that it would resolve upward would have meant carrying risk through months of chop for no confirmed reason. Waiting for the actual break, above a well-defined trendline, with visible follow-through, is what turns a pattern you’re watching into a signal you can act on.
And the prior trend gave the pattern its context. A Triangle by itself is just a shape. A Triangle following a genuine, sustained advance off a real low carries more weight than the same shape appearing in a stock with no underlying strength behind it. Reading a chart well means reading the whole story the price has told, not just the most recent few weeks of it.