This is the twenty-sixth post in my Real Trade Series, where I go through actual trades from my own charts and journal notes, wins, losses, and everything in between. This one is short in a very literal sense. According to my trade journal, this position was opened and closed at the same timestamp, meaning the loss was realized essentially the moment the trade was logged. There’s no multi-day story here, no slow drift, no judgment call about when to exit. Just an entry that immediately went the wrong way.
A general note that applies to this post and several others in this series: the open and close dates and times shown come from when the trade was recorded in my trade journal, not necessarily the exact timing the order was actually placed and filled in the market. There can be a gap between the two, and readers should discount the precise timestamps accordingly rather than treating them as a live, tick-by-tick record of execution.
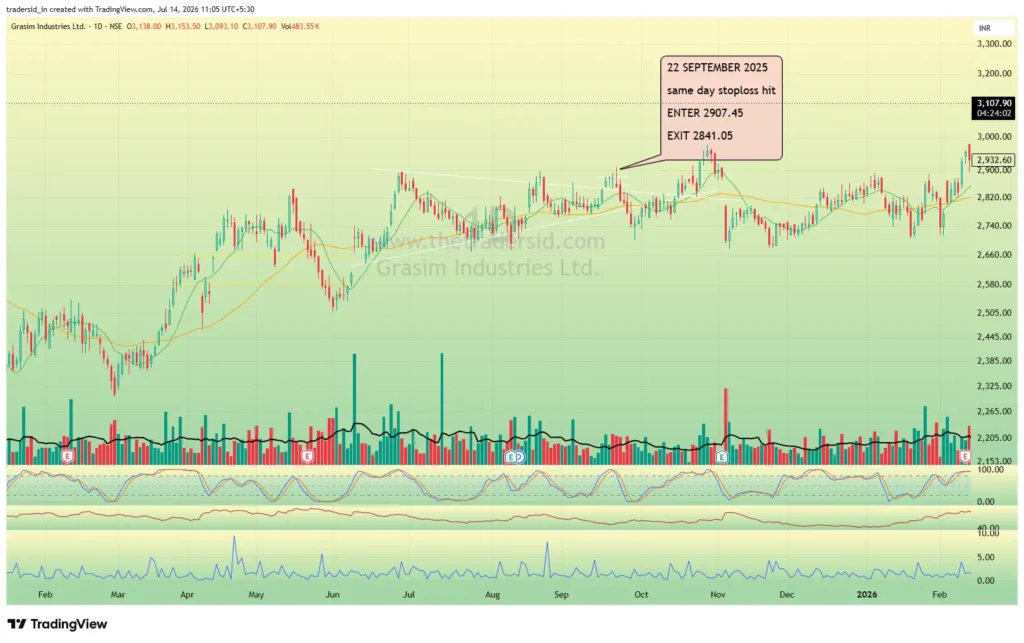
As with the other posts in this series, I didn’t have a saved screenshot from the actual date of this trade, so any chart markup is done on today’s chart, with the entry and exit placed at the historical prices and dates from my journal.

What I was looking at
Grasim had been in a genuine uptrend through most of 2025 by the time I entered this trade on 22nd September. Looking at the chart now, the stock had been climbing since around February, working through a basing period in the spring before breaking out and continuing higher through the summer months. By September, price was tracking along a clearly rising trendline, with a series of higher lows building underneath it since around June.
My entry at 2,907.45 came right near the top of that rising channel, close to where price had been repeatedly testing resistance over the prior few weeks. That’s not necessarily a bad place to enter a trending stock. A breakout above a well-established rising channel, if it holds, can be a legitimate continuation setup. The question is whether this particular attempt was a genuine breakout or a false push right into resistance that had already rejected price more than once nearby.
What actually happened
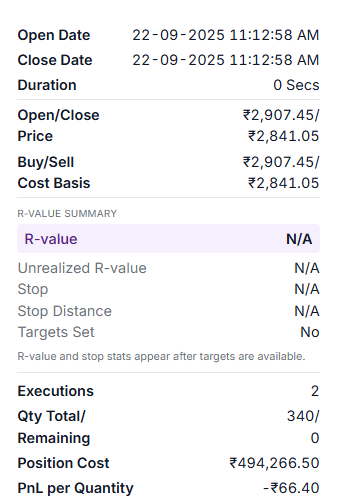
According to the trade record, I bought 170 shares at 2,907.45 and sold the same 170 shares at 2,841.05, both logged at the same moment. That’s a loss of 66.40 per share, a decline of roughly 2.3% from entry to exit, and a gross loss of 11,288 rupees on the position.
What stands out most in the journal isn’t the loss itself, it’s what’s missing around it. There’s no stop loss recorded for this trade. There’s no profit target recorded either. The platform’s own summary confirms it plainly: targets weren’t set, and stop distance shows no value. This wasn’t a trade that got stopped out according to a plan I’d defined in advance. It was a position that was opened and immediately closed, without the two most basic risk parameters I’d normally have in place before entering anything.
Why this one is hard to fully reconstruct
I want to be honest about the limits of what I can say here. Because the open and close timestamps are identical, and because there’s no note explaining the decision, I genuinely don’t know whether this was a same-day mental stop I executed manually the instant price moved against me, a fast intraday reversal that made the trade untenable within minutes, or simply how the entry got logged into the journal after the fact even if the real-world timing was slightly different. That’s exactly why the timestamp caveat matters here more than in most of the other trades in this series. I can’t build a precise story around minute-by-minute price action I don’t actually have a record of.
What I can say is that no stop was recorded before the loss happened, and that’s true regardless of how quickly the reversal actually unfolded in real time. Whether I was managing the position manually in the moment or something else was going on, the absence of a predefined stop means this trade wasn’t protected by a plan. It was protected, if that’s even the right word, by attention and reaction alone.
What the chart suggests, with real uncertainty attached
Looking at the broader picture now, this entry landed right at a level price had struggled to clear cleanly on a couple of earlier attempts through August and into September. The rising trendline that had supported the move since around June was still technically intact at the time of entry, but resistance just above it had already shown some resilience. A rejection at that specific level, right where earlier attempts had also stalled, is a plausible explanation for why this trade reversed so quickly.
I want to be careful not to overstate this. I’m reading a chart months later and building a story that fits the outcome, which is a easy trap to fall into. It’s entirely possible the real reason for the loss was something else entirely, a broader market move that day, news specific to the stock, or simply a level of volatility that had nothing to do with the resistance zone I’m pointing to now. Without a note from the time, I can describe what the chart shows in hindsight, but I can’t claim certainty about why the trade actually failed.
What this trade taught me
The clearest, most defensible lesson here has nothing to do with trendlines or resistance zones. It’s that this position had no stop and no target logged before the loss occurred. Regardless of how fast the reversal happened or what actually caused it, entering without those two numbers already defined is the same mistake whether the eventual loss takes seconds or weeks to play out. A stop that’s decided in the moment, under the pressure of a position already moving against me, is a fundamentally weaker version of a stop I’d set calmly before ever entering the trade.
This is also a useful trade to sit next to Kopran, the previous post in this series. Kopran was a win without a note explaining the process. This one is a loss without a stop protecting the position. Both are honest gaps in my own discipline, just showing up on opposite sides of the outcome. A trading record that only includes the well-documented decisions would miss both of these, and I think that would make the record less useful, not more polished.
There’s a pattern worth naming across a handful of trades in this series now. BASF had no entry plan at all. Dabur had a plan that failed and then got repeated at a worse price without a fresh reason. Kopran had a result without an explanation. Grasim has an entry without protection. None of these are the same mistake, but they all point toward the same underlying issue, a process that isn’t consistently applied trade to trade. The setups I actually plan for, the ones with a defined stop, a target, and a note explaining the reasoning, tend to be the trades I can learn something concrete from regardless of outcome. The ones missing those pieces are the ones I keep having to write posts like this about, admitting after the fact that a basic step got skipped.
That’s really the point of publishing a trade like this one. It’s not a dramatic loss in rupee terms. It’s a small, forgettable number next to some of the bigger wins and losses elsewhere in this series. But the pattern underneath it, entering without a defined stop, is exactly the kind of habit that eventually shows up in a much larger loss on a day the market moves further and faster than this one did. Catching it here, on a trade that only cost a little over eleven thousand rupees, is a lot cheaper than catching it for the first time on a trade that costs considerably more.