Most people are introduced to the stock market through one of two extremes. On one side is long-term investing, where you buy a stock and hold it for years, riding out every dip because the underlying business is sound. On the other side is day trading, where positions open and close within hours, sometimes minutes, driven by charts, news, and raw speed. Swing trading sits in between, and understanding how it works starts with understanding why that middle ground exists at all.
What Swing Trading Actually Means
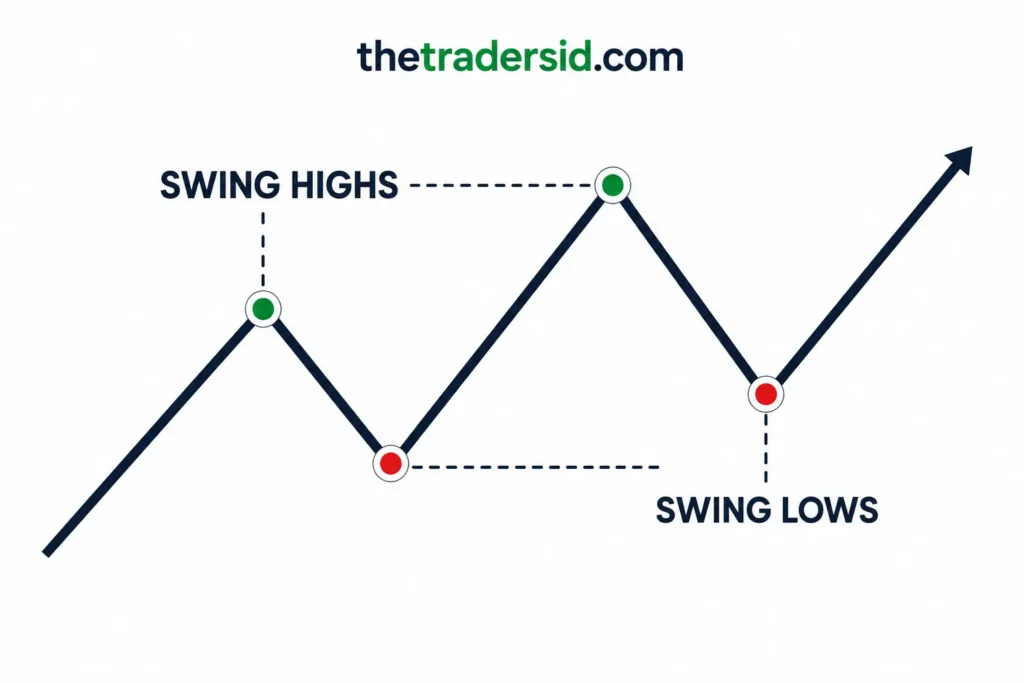
Swing trading is a style of trading where positions are typically held for a few days to a few weeks, rarely longer than a couple of months. The goal is to capture a “swing,” a meaningful price move within a larger trend, without needing to predict where the stock will be a year from now, and without needing to sit glued to a screen watching every tick.
A swing trader isn’t trying to catch the entire move of a stock from its lowest point to its highest point. That’s close to impossible to do consistently. Instead, the goal is to identify a stock that is already showing signs of strength, enter when the odds are favourable, and exit once the immediate move has played out or the setup breaks down. Think of it less like predicting the future and more like reacting well to what the market is already showing you.
This matters because it changes the entire mindset required. A long-term investor asks, “Is this a good business?” A day trader asks, “What’s happening in the next ten minutes?” A swing trader asks a different question entirely: “Is this stock set up to move over the next one to three weeks, and is the reward worth the risk if I’m wrong?”
The Building Blocks of a Swing Trade
Every swing trade, regardless of the specific strategy used, is built on a handful of common elements.
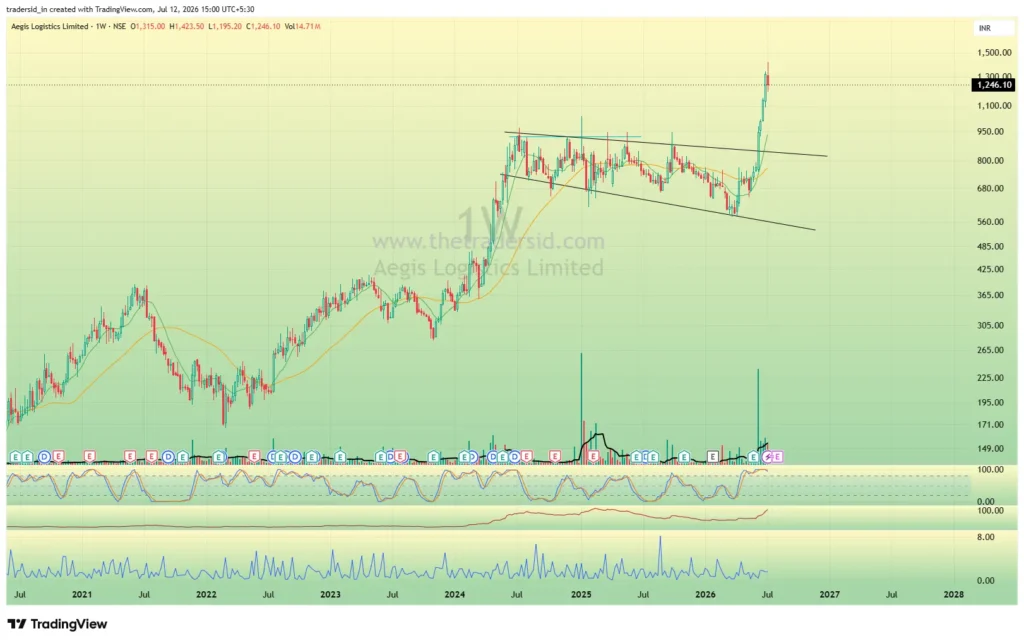
Trend and structure. Swing traders generally prefer trading in the direction of the larger trend rather than against it. A stock that has been in a strong uptrend on the weekly chart is treated very differently from one that has been drifting sideways or falling. The logic is straightforward: it’s easier to catch a wave that’s already forming than to bet on one that hasn’t started yet.
Setups and patterns. Rather than reacting to every price movement, swing traders look for specific, repeatable patterns that have historically preceded strong moves. These might include a stock consolidating in a tightening range after a strong rally, a sharp pullback that resets an overextended stock, or a breakout from a well-defined base. The pattern itself isn’t magic. What it represents is a period where buyers and sellers have reached a temporary balance, and price is coiling before its next decisive move.
Entry timing. Once a setup is identified on a higher timeframe, like the weekly chart, the actual entry is usually refined using a shorter timeframe, like the daily chart. This is where a trader decides the specific point at which the trade is confirmed, often when price breaks above a key level with strength.
Risk management. This is where swing trading separates itself most clearly from gambling. Every trade is entered with a predefined stop loss, a price at which the trader accepts they were wrong and exits to limit the damage. Position sizes are calculated so that no single trade, even a losing one, can meaningfully hurt the overall portfolio. Professional swing traders often risk a small, fixed percentage of their total capital on any one trade, frequently in the range of 1%, regardless of how confident they feel.
Exit strategy. Just as important as knowing when to enter is knowing when to leave. Some swing traders use a fixed reward-to-risk target, exiting once the trade has moved a certain multiple of the amount they were risking. Others scale out in parts, locking in some profit early and letting the rest run with a trailing stop, so a winning trade isn’t cut short too soon but also isn’t given back entirely if the trend reverses.
Why the Weekly and Daily Timeframes Matter
A common thread among swing traders is the use of two timeframes together rather than one. The weekly chart smooths out the daily noise and shows the bigger picture: is the stock in a genuine uptrend, has it built a healthy base, is it part of a sector that’s showing relative strength against the broader market. The daily chart is then used to fine-tune the entry, catching the specific day the setup confirms.
This two-timeframe approach solves a common problem for newer traders, which is mistaking short-term noise for a real signal. A stock might look exciting on a five-minute chart and mean absolutely nothing on a weekly chart. Zooming out first, then zooming in for timing, keeps decisions anchored to what actually matters.
Why Risk Control Is the Real Skill
It’s tempting to think swing trading is primarily about finding the right stocks. In reality, most of the work that separates consistently profitable traders from everyone else happens in risk management, not stock selection.
No pattern, no matter how well it has performed historically, works every single time. A trader who is right on the direction of a stock 50% of the time can still be highly profitable if their winners are meaningfully larger than their losers, and if losses are always kept small and predictable. Conversely, a trader who is right 70% of the time can still lose money overall if the losing 30% wipes out gains because losses were left to run unchecked.
This is why concepts like position sizing, stop losses, and reward-to-risk ratios aren’t optional extras bolted onto a strategy. They are the strategy, arguably more than the chart patterns themselves. A trader who ignores this and lets emotions dictate the exit, holding losers too long hoping they recover, or cutting winners too early out of fear, will struggle regardless of how good their stock selection is.
The Role of Psychology
Swing trading occupies an uncomfortable middle ground psychologically. Trades don’t resolve in minutes like day trading, so there’s no immediate feedback to distract from the discomfort of a decision. But they also don’t unfold over years like long-term investing, so there’s no long runway to simply wait out short-term volatility. A swing trader has to sit with a decision for days or weeks, watching it fluctuate, without either the instant closure of a day trade or the patience buffer of a long-term hold.
This is why journaling trades, documenting not just entries and exits but the reasoning and emotions behind them, tends to separate traders who improve over time from those who repeat the same mistakes. Patterns in behaviour, chasing a stock after it’s already moved, exiting a winner too early out of fear, skipping a stop loss because “it’ll probably come back,” are far easier to spot in writing than in the moment.
Bringing It Together
Swing trading works by combining a repeatable method for identifying stocks likely to move, a disciplined process for entering and exiting those trades, and strict controls on how much capital is put at risk on any single idea. None of these three pieces works well in isolation. A great setup with poor risk management can still blow up an account. Excellent risk management applied to random, low-quality setups will simply lose money slowly instead of quickly.
The traders who do well over time aren’t the ones who find some secret pattern nobody else knows about. They’re the ones who apply a sound, repeatable process consistently, manage risk without exception, and treat losing trades as a normal, expected part of the process rather than a personal failure. Swing trading rewards discipline and consistency far more than it rewards prediction, and understanding that distinction early is often what determines whether someone sticks with it long enough to get good at it.