This is the third post in my Real Trade Series, where I go through actual trades from my own charts and journal notes, wins, losses, and everything in between. This one is a loss, and I think it’s actually one of the more useful posts in this series because of that.
Not every setup works. That sounds obvious to say, but it’s easy to forget when most trading content only shows the winners. This trade in Adani Power didn’t work, and walking through why is more useful than pretending every trade I take turns into a clean gain.
What I was watching
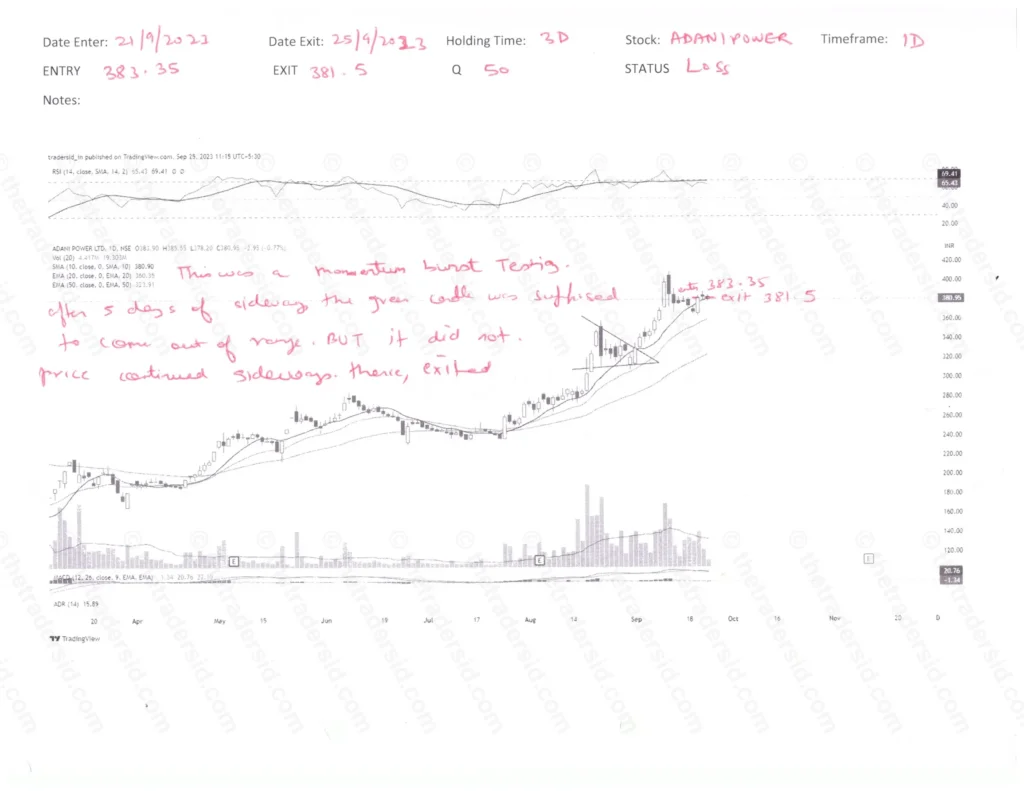
Adani Power had been in a strong uptrend for months leading into this trade. If you look at the daily chart from around April 2023 onward, the stock had moved from the low 200s all the way up past 380, a genuinely strong move with the 10 and 20 day moving averages both trending up nicely underneath price. This wasn’t a stock in question of trend direction. The direction was clearly up.
By September, though, the stock had entered a different phase. After that strong run, price moved into roughly five days of sideways consolidation, a tight range where it wasn’t giving up much ground, but it also wasn’t pushing to new highs either. This is a completely normal thing for a strong stock to do. It runs, then it pauses to digest the move, and eventually either breaks higher to continue the trend or breaks down if the move is over.
What triggered the entry
During that sideways period, I saw a green candle that looked like it was ready to be the one that pushed price out of the range. I wrote this down in my notes at the time, this was a momentum burst test. I wasn’t entering because I had a fully formed pattern with a clean pivot point. I was testing whether this particular green candle, after five days of tightening range, would be the trigger for a continuation move higher.
I entered at 383.35.
What actually happened
It didn’t work. The green candle that looked promising turned out to be exactly that, one green candle, not the start of a breakout. Price didn’t push higher. It just continued sideways, still inside the same range it had been consolidating in for days. There was no follow through, no expansion in volume, nothing to confirm that the burst I thought I was seeing was real.
Three days later, I exited at 381.5. A small loss, about half a percent, but a loss all the same. Status: loss.
Why I’m calling this useful even though it lost
Here’s the thing about this trade that I think matters more than the outcome. I wrote “testing” in my notes before I even took it. I knew going in that this was me trying to answer a question, does a single strong green candle after a period of sideways consolidation reliably mark the start of a new leg higher. This trade answered that question with a no, at least in this specific instance.
A loss like this is completely different from a loss where you ignored your plan, chased a stock without a setup, or held past your stop because you were hoping it would come back. This was a defined test, with a defined risk, and it gave me a defined answer. I didn’t hold on hoping the breakout would eventually show up. Price continued sideways instead of expanding, so I exited.
That’s really the core lesson here. A single strong candle inside a longer consolidation is not the same thing as a confirmed breakout. It might be the start of one, and sometimes it is, but you need to see actual range expansion and volume confirmation before you can call it that with any confidence. One green candle in the middle of five days of chop is not enough evidence on its own.
What I’d want to see next time
If I run this test again in a similar situation, the thing I’d want to see before entering is either a close clearly outside the recent consolidation range, not just a green candle inside it, or a volume spike that’s meaningfully above the recent average, ideally both together. A green candle in the middle of a tight range can just be noise. A green candle that closes above the range with strong volume behind it is a different, more convincing signal.
I also think there’s a sizing lesson buried in here. Because I labeled this a test before I took it, the size was appropriately modest, and the loss stayed small as a result. That’s the value of knowing when you’re testing an idea versus when you have high conviction in a fully qualified setup. Test trades should be sized like tests, not like your best ideas.
The bigger point
Adani Power went on to keep trending well after this trade closed, which is honestly a little humbling to look back on. The stock I was trying to catch a breakout in did eventually break out, just not on the timeline or the signal I was testing. That’s a separate lesson in itself, being wrong about the timing of an entry doesn’t mean you were wrong about the stock or the trend.
I’d rather take small, defined losses on tests like this one than either avoid testing altogether or size these trades as if they were high conviction setups. The loss here did exactly what it was supposed to do. It cost me a small, known amount, and it taught me something concrete about how much confirmation I actually need before trusting a momentum burst inside a consolidation.