Price action gets thrown around constantly in trading circles, often as a badge of credibility, “I only trade price action,” as if the phrase alone settles the question of whether a method is sound. It also draws real skepticism, usually from people who see it as pattern recognition dressed up as analysis, no different from spotting shapes in clouds. Both reactions miss what price action actually is and what it isn’t. Understanding it clearly means separating the legitimate reasoning behind it from the parts that genuinely deserve skepticism.
What Price Action Actually Means
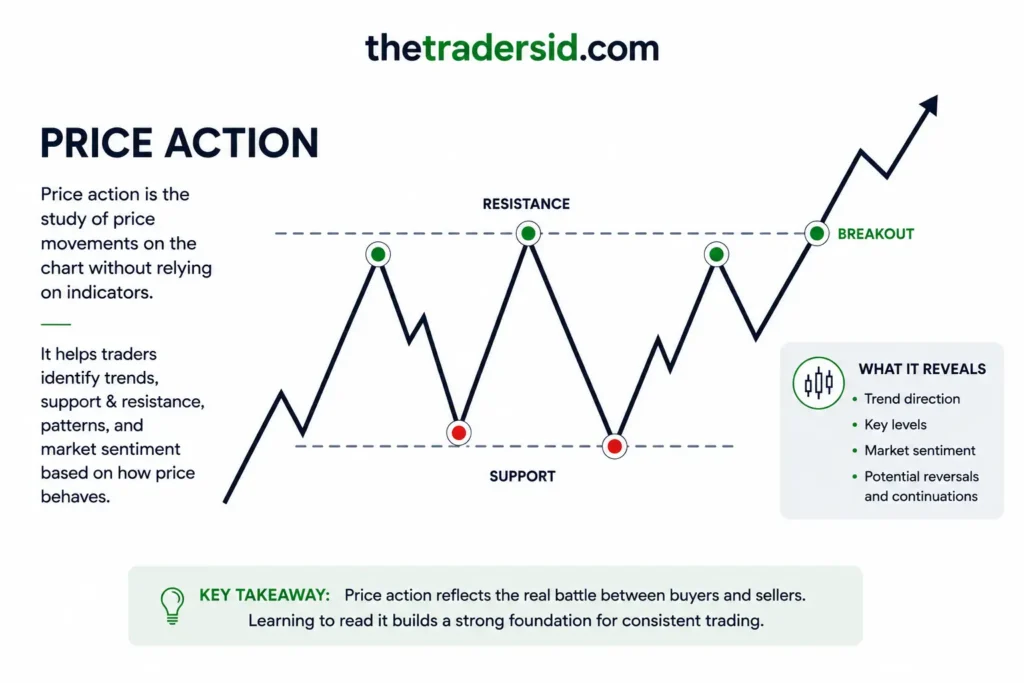
At its simplest, price action is the study of a stock’s price movement itself, its highs, lows, closes, the shape of candles, the structure it forms over time, without relying on secondary indicators like RSI, MACD, or oscillators to interpret what’s happening. It’s reading the raw record of what buyers and sellers actually did, rather than a mathematical transformation of that record.
This isn’t the same as staring at a chart and freeform interpreting shapes. Legitimate price action analysis looks at specific, definable things: where a stock found support and why, whether a breakout came with real volume behind it, whether higher lows are actually forming or the trend has started making lower highs, whether a pullback is orderly or erratic. These are observable, repeatable characteristics, not vague impressions.
Price and volume are also the only two truly primary inputs in markets. Every other indicator, as discussed elsewhere, is derived from these two. Price action, in that sense, is simply working from the original source rather than a processed version of it.
The Case for Why It’s Real
The strongest argument for price action isn’t mystical, it’s structural. Price reflects the actual transactions that happened, actual capital committed by actual participants. A support level isn’t meaningful because it looks nice on a chart, it’s meaningful because it represents a price where enough buyers stepped in with real money to absorb the available selling. When that level gets tested again, there’s a reasonable, non-magical explanation for why it might hold again: some of the same participants, or participants using similar logic, tend to act similarly at similar levels.
This is reinforced by the fact that markets aren’t purely random. If price moves were entirely random, no pattern would have any predictive value whatsoever, and nothing in trading would work better than a coin flip. But markets are driven by participants who share broadly similar information, similar incentives, and often similar analytical frameworks. Institutional participants, who move enough volume to actually influence a stock’s structure, frequently do use structural levels, prior highs, prior lows, consolidation zones, as reference points for their own decisions. Price action isn’t claiming to predict the future with certainty. It’s claiming that the past behaviour of a stock’s structure carries some genuine information about the balance of supply and demand, which is a far more modest and more defensible claim.
Volume adds a layer of real verification to this. A breakout on volume meaningfully above average reflects actual increased participation, not just a pattern that happened to resolve upward. This is measurable, not subjective.
The Case for Skepticism
The skepticism toward price action isn’t baseless, and it’s worth taking seriously rather than dismissing outright.
Pattern recognition can become pattern invention. Human brains are extremely good at finding patterns, sometimes in places where none genuinely exist. Given enough charts and enough hindsight, it’s possible to look back and describe almost any outcome as having been “visible” in the price action beforehand. This is a real risk, and it’s why price action only holds up when patterns are defined in advance, with specific, testable criteria, rather than described loosely after the fact.
Not every level or pattern is meaningful. A support level that’s held twice by pure coincidence isn’t fundamentally different from one that’s genuinely significant, until it’s tested a third time and either holds or fails. Price action analysis can slide into confirmation bias easily, where a trader sees what they expect to see because they’ve already decided a setup looks good.
It can be used to justify almost anything after the fact. This is the most legitimate criticism. Because price action is somewhat subjective in its interpretation, especially around candlestick patterns and less rigorously defined setups, it’s easy to explain any outcome after it happens. A stock that went up “found support and reversed.” A stock that went down “broke down from a distribution pattern.” Both explanations sound reasonable in hindsight regardless of which one actually happened, and that flexibility should make anyone cautious about treating price action as infallible.
Where the Line Actually Sits
The honest answer is that price action is real in the sense that price and volume reflect genuine, meaningful market activity, and structure built from that activity carries real information about supply and demand. It is not real in the sense of being a crystal ball, and it doesn’t work reliably when applied loosely, inconsistently, or purely through hindsight.
What separates useful price action analysis from wishful pattern-spotting is specificity and consistency. A setup defined clearly in advance, a base of a defined minimum length, a breakout requiring a defined volume threshold, a pullback expected to hold at a defined level, can be tested, tracked, and reviewed honestly. A setup that only becomes clear after it’s already worked out isn’t price action, it’s storytelling.
This is also why price action works best combined with a small number of objective confirming inputs, like volume and a couple of moving averages, rather than as a completely standalone, purely visual judgment call. The structure gives context. The confirming inputs reduce the room for wishful interpretation.
Why This Matters for How We Trade
Every setup used in this system, Triangle Patterns, HTF, and Gap Ups, is fundamentally a price action framework. Each one is built around clearly defined structural conditions on the weekly chart, confirmed with specific daily-level triggers and volume, rather than relying on lagging indicators to make the call. This isn’t a stylistic preference. It reflects the belief that price and volume are the only genuinely primary data available, and that the most defensible version of price action is one that’s specific enough to be reviewed and wrong enough of the time to be honest about its limits.
Price action isn’t a guarantee, and nobody trading it honestly claims that it is. What it offers is a framework for reading the market’s own record of itself, provided that record is interpreted with clear, consistent, predefined rules rather than convenient hindsight. That distinction, rules set before the outcome versus explanations built after it, is really what determines whether price action is a legitimate edge or just a comforting story.