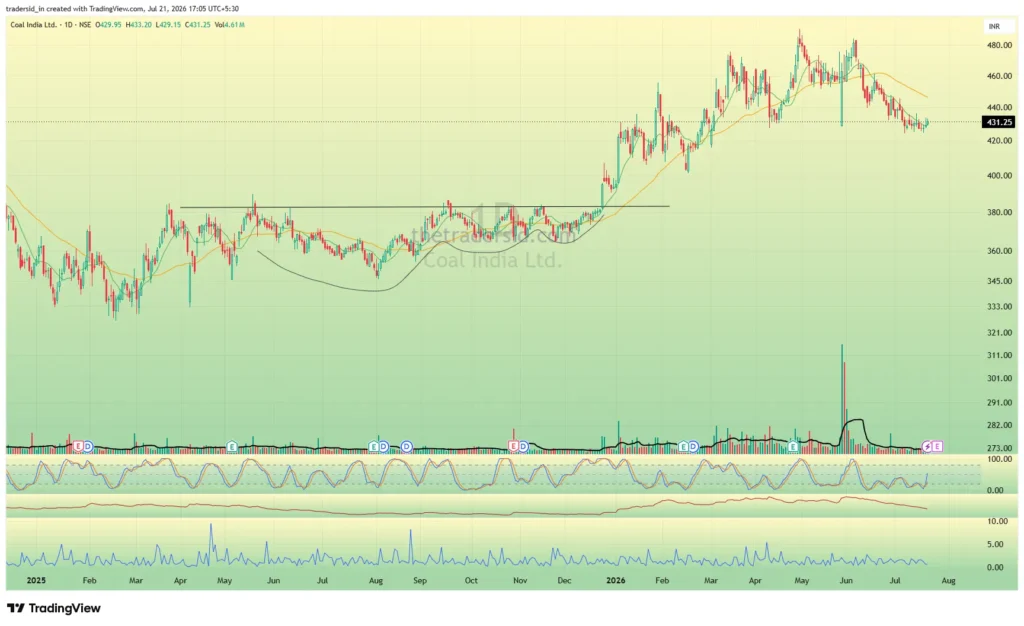
Every setup I trade eventually comes back to the same core idea. Price that was moving freely starts getting squeezed. Sellers lose interest. Buyers stop giving up ground. The range tightens until something has to give. That’s the heart of my Triangle pattern, and it’s also the heart of what’s called the Volatility Contraction Pattern, or VCP.
I don’t treat VCP as a separate, fourth setup sitting next to Triangle, HTF, and Gap Up. It’s a variation of the Triangle, a different lens on the same underlying behavior. Where a classic Triangle is defined by two converging trendlines you can draw on a chart, a VCP is defined by the volatility itself, the size of each swing getting smaller and smaller as the stock coils. Same phenomenon. Different way of reading it.
What Makes A VCP A VCP
A VCP shows up as a series of contractions, not one clean shrinking triangle. Instead of a single pullback, you often see two or three, each one shallower than the last. The stock pulls back 15%, then rallies, then pulls back 8%, then rallies, then pulls back 4%. Each contraction is tighter than the one before it. That stair-step tightening is the signature.
What I want to see across those contractions:
- Higher lows. Each pullback holds above the previous one, showing sellers running out of ammunition earlier each time.
- Tightening price ranges. The distance between the swing high and swing low of each contraction keeps shrinking. Wide, then narrower, then narrow.
- Volume drying up. As the range compresses, volume should fade with it. Low volume during contraction tells you supply is thinning out, not that interest is dying.
- Price holding above key moving averages. The stock stays constructive relative to its 20, 50, or 200-week levels rather than breaking down through them during the pullbacks.
Put together, this tells a specific story. Sellers are getting exhausted. Each round of selling does less damage than the last. Demand is quietly absorbing whatever supply is left. The tighter the coil, the less float is available to trade, and the more forceful the move tends to be once buyers finally step in with conviction.
Why It’s A Variation, Not A New Pattern
A classic Triangle on my charts is usually drawn as two converging trendlines, a flat or sloping resistance line up top and a rising support line underneath, with price squeezed between them. A VCP is describing the same squeeze, just through the lens of successive contractions rather than two neat trendlines.
In practice, most clean VCPs will also draw out as a Triangle if you put trendlines on them. And most clean ascending Triangles, if you measure the size of each pullback inside them, are also contracting in volatility. They’re two views of one mechanism: volatility compressing before a directional resolution. I use VCP language specifically when the contractions are stair-stepping down in stages rather than forming one continuous, symmetrical taper. If a stock has already had two or three distinct rounds of contraction before you’re looking at it, VCP is the more accurate way to describe what you’re seeing.
How I Scan For It
Training your eyes to spot coiling takes repetition, but there’s a shortcut. Instead of scanning stock by stock for the perfect triangle shape, scan for tightness itself. Look at the weekly range of the last several candles relative to the weekly range further back. When recent weeks are printing noticeably smaller ranges than prior weeks, on lighter volume, you’ve found a coil, whether or not it draws a textbook triangle.
This matters at the individual stock level, but it also tells you something bigger. If you scan through the Nifty 200 on a given week and can’t find many stocks coiling like this, that’s information too. It means the broader tape is loose and wide rather than tight and controlled, which tends to go hand in hand with weaker overall conditions. Fewer coiled setups available is often the market’s way of telling you to do less, not force trades that don’t have this compression behind them.
Entry, Same Rules As Triangle
Because VCP is a variation of the Triangle rather than a separate system, my entry and risk rules don’t change. I wait for a decisive break above the resistance defined by the most recent, tightest contraction, not an early or partial move. Stops sit at 1.25x ATR, sized so no single trade risks more than 1% of total capital, with a minimum 1:2 reward to risk before I’ll take it. Position sizing follows the same 20% max capital per position cap either way.
What changes is conviction, not mechanics. A stock that’s contracted through two or three progressively tighter rounds, holding higher lows the whole way, with volume drying up and price respecting its key moving averages, is telling you more than a single, looser triangle would. The tighter and more disciplined the coil, the more willing I am to lean into that setup within my existing risk framework.
Why I’d Rather Wait Than Chase
The temptation with any consolidation pattern is to jump in before it’s resolved, guessing at which way the coil breaks. I don’t do that with Triangle, and I don’t do it with VCP either. Compression by itself isn’t a signal to buy. It’s a signal to watch closely and wait for the breakout to confirm which side wins.
The payoff for that patience is the risk to reward. A tight coil gives you a tight, logical stop just below the most recent contraction low, and a defined breakout point to measure your target from. That combination, small risk and a real shot at a large, fast move, is why I’d rather wait through weeks of a stock doing nothing than chase something already extended. The best setups aren’t the ones moving the most right now. They’re the ones compressing the hardest, quietly, before anyone else notices.