This is the twenty-second post in my Real Trade Series, where I go through actual trades from my own charts and journal notes, wins, losses, and everything in between. This one is a win on paper, but going back through my own notes from the time, I caught myself admitting to something I’d missed while I was still in the trade. I think that’s worth publishing just as much as the clean wins are.
A general note that applies to this post and several others in this series: the open and close dates and times shown come from when the trade was recorded in my trade journal, not necessarily the exact timing the order was actually placed and filled in the market. There can be a gap between the two, and readers should discount the precise timestamps accordingly rather than treating them as a live, tick-by-tick record of execution.
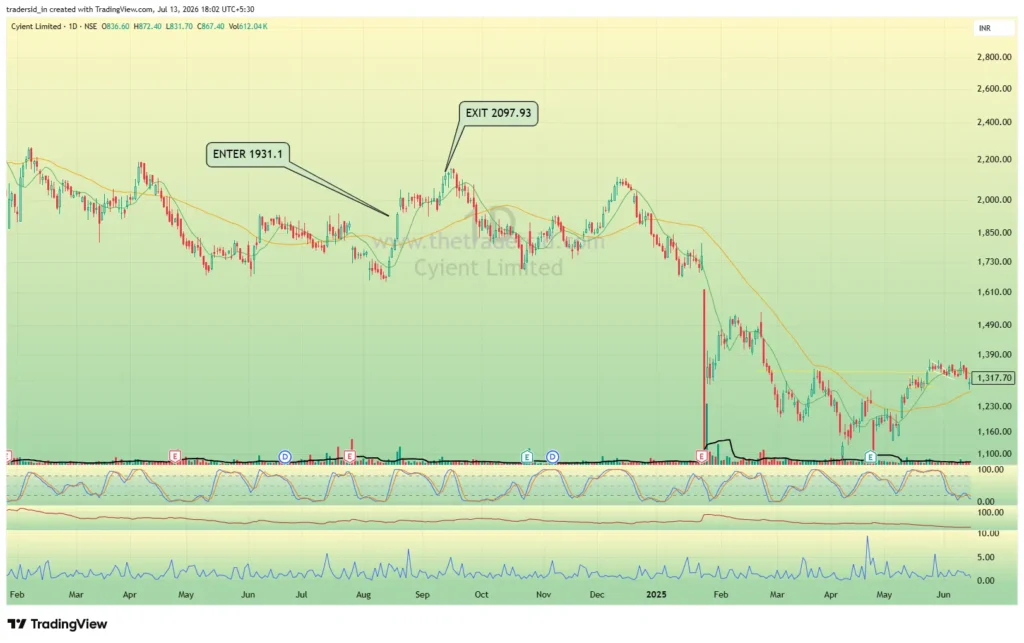
Same note as always on the chart: I didn’t have a saved screenshot from the actual dates of this trade, so the markup here is done on today’s chart, placed at the historical prices and dates from my trade journal.

What I was looking at
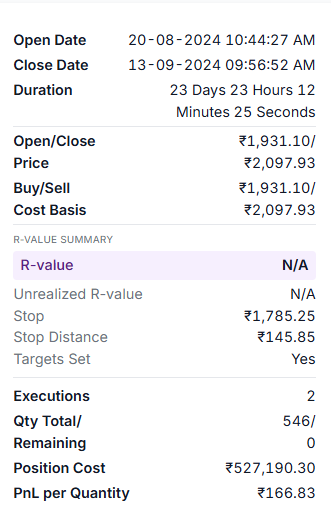
Cyient came up on 20th August 2024. I entered at 1,931.10 with a stop at 1,785.25, giving me a defined risk of 145.85 per share. I held the position for just under 24 days and closed it on 13th September at 2,097.93, a gain of 166.83 per share, for just over 1.1R on the trade.
What my notes actually say
This is where it gets more interesting than a standard write-up. At the time, I noted that on the daily timeframe, price was just touching the 200 EMA, not clearly through it. That’s a meaningful distinction. A stock decisively clearing a long-term moving average is a different signal from one that’s merely brushing against it, and I flagged that at the time as something to watch rather than something confirmed.
Then, in the same note, I wrote something more direct: on the weekly timeframe, the 10 and 20 EMAs were actually below the 50 EMA, and I’d sadly missed noting that before entering. That’s not a small detail. It’s a sign the weekly trend structure wasn’t as clean as I would normally want before taking a trade like this.
Why I’m calling this a win with a gap, not just a win
The trade worked. Cyient moved in my favor, I exited with a modest gain, and the stop was never at risk. If I only looked at the outcome, this is a clean, forgettable win. But the process behind it had a real hole in it. I entered a trade where the daily chart hadn’t confirmed clearly, and where I’d genuinely missed checking a weekly EMA alignment that, had I caught it in advance, might have made me pass on the trade entirely or size it smaller.
The R-multiple here backs this up in its own way. 1.1R is a modest result compared to some of the bigger wins in this series. That’s roughly consistent with a trade that wasn’t as fully confirmed going in as my best setups usually are. It worked, but it didn’t work with much room to spare.
What was actually missing
The core issue wasn’t the entry price or the stop placement, both of those were reasonable. It was that I hadn’t finished the checklist before pulling the trigger. Checking whether the weekly EMAs are actually aligned in the direction of the trade is a basic step, and I skipped it here, not out of any specific reasoning, just an oversight I only caught by writing my notes down honestly afterward.
What this trade taught me
A win doesn’t mean the process was sound. This is exactly the kind of trade that’s easy to file away as “it worked, move on,” and that instinct is dangerous. If I don’t go back and read my own notes honestly, I’d never catch that I got lucky on a setup that wasn’t fully there. The daily chart hadn’t clearly confirmed, and the weekly trend wasn’t aligned the way I usually require. I got paid this time. That doesn’t mean the analysis was complete, and it’s exactly the kind of gap that, left unexamined, turns into a pattern of trades that work until, eventually, one doesn’t.